 |
 |
 |
||||||||||||
 |
 |
 |
 |
 |
 |
 |
 |
|||||||
|
Preface • Introduction • Study Objectives • Community Participation • Regional, Physical and Ecological Setting Methods • Survey Protocol • Surveyors • Data Compilation • Data Analysis Results • Migration Chronology • Breeding Species • GSL Species Accounts • Species Distribution Discussion • Recommendations • Acknowledgements • Definitions/Abbreviations • Literature Cited Report & Appendices: 1 • 2 • 3 • 4 • 5 • 6 • 7 • 8 21-Year Waterbird Survey Synopsis & Appendices: 1B • 2B • 4B • 5B • 6B • 8B
|
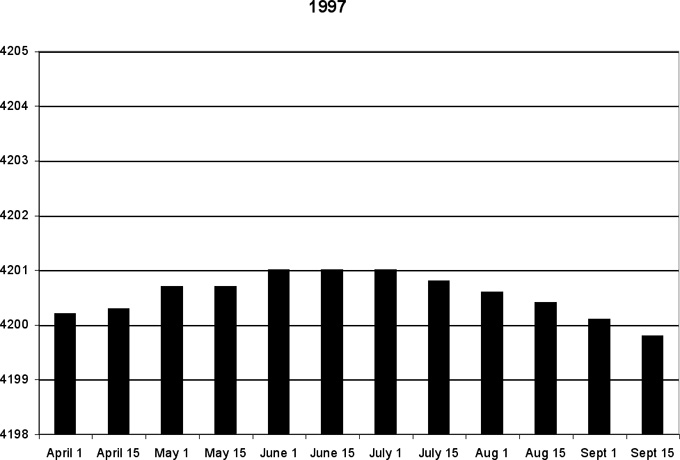
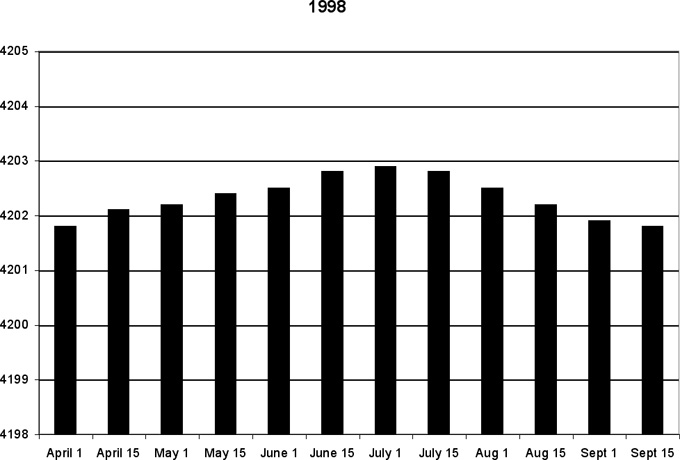
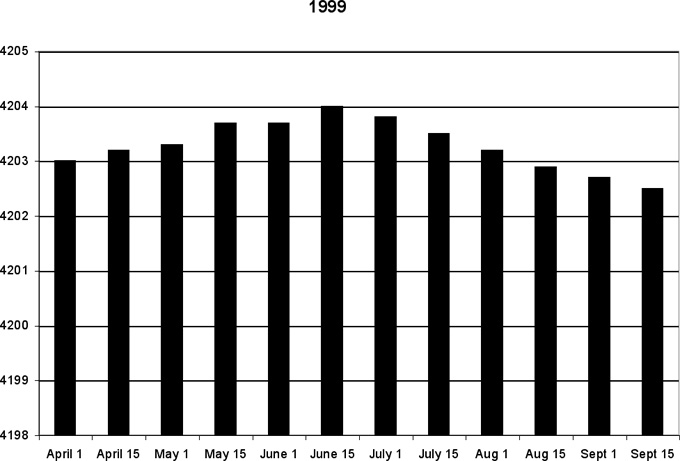
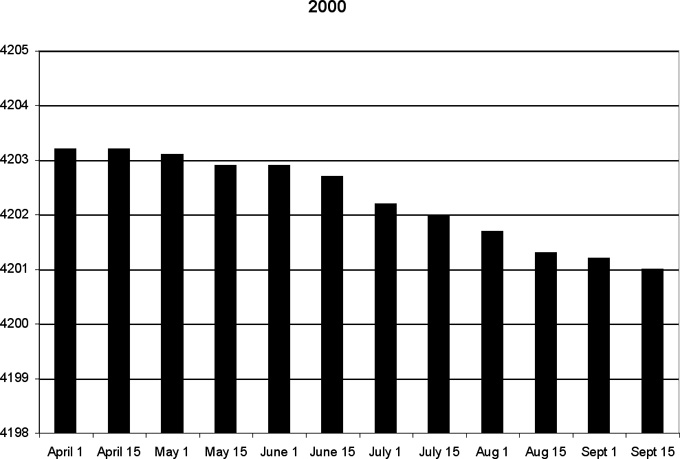
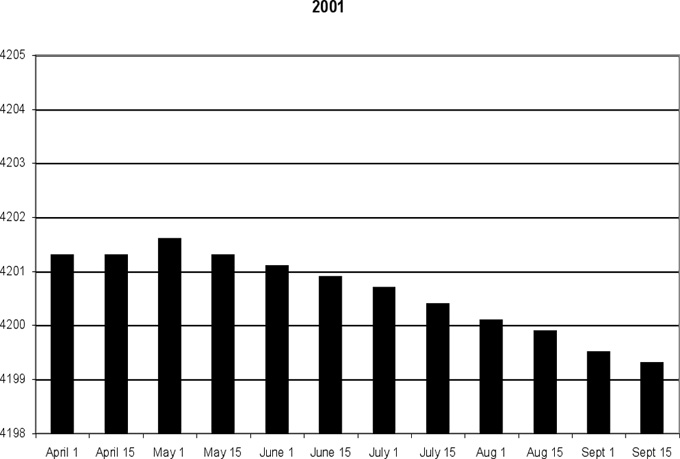
ResultsGreat Salt Lake Climate and ElevationHistorical PerspectiveThe long-term (1847-2001) GSL mean elevation is 4200.4' ASL. These data were collected from the South Shore Boat Harbor. The range between record low and high lake elevations is 20.5'. The low occurred on November 1, 1963 at 4191.35' ASL and the high on June 3, 1986 at 4211.85' ASL (Table 3). The rate of change in elevation varies with climatic patterns and especially with variation in periodic weather patterns. Hydrologic data indicate the lake will be equal to or exceed 4,204' ASL ten percent of the time, and conversely, the lake will be equal to or less than 4193.5' ASL ten percent of the time (Austin 1980). This implies that the predicted change in GSL elevation will fall within a 10.5' pattern 80% of the time. From the same hydrology data set, which has 125 years of GSL elevation records modified by the 1980 rate of upstream water consumption, it is predicted that GSL will exceed 4210' ASL approximately once every 200 years (Austin 1980).1997-2001The GSL mean elevation was 4201.9' ASL during the five-year study period. The range was 5.3' with a low lake elevation of 4199.3' ASL and a high of 4204.6' ASL occurring on June 15, 1999 and September 15, 2001 respectively. The most notable rate of change occurred between 1999 and 2001 at 5.3', and the greatest rate of change within one year was 2.4' in 2000 (Figure 4).
Table 3. Notable weather periods and lake elevations at Great Salt Lake.
Figure 4. Great Salt Lake elevation at two-week intervals during the Waterbird Survey, 1997-2001.
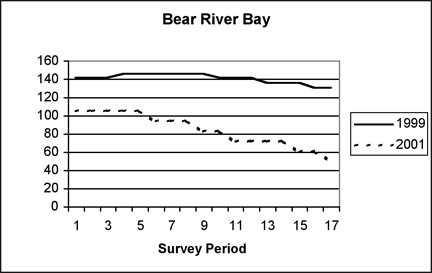
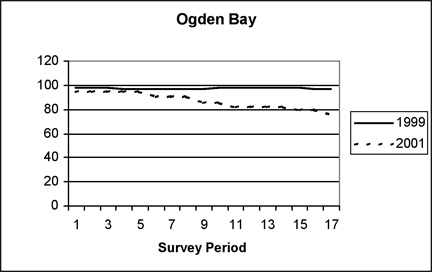
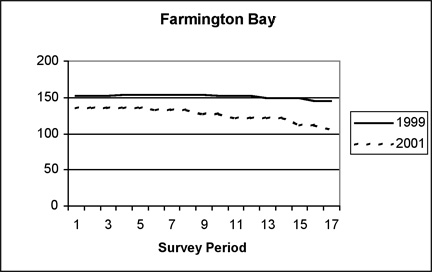
Fluctuations in the lake elevation throughout seasons and between years correlated directly with changes in the surface area of the open water bays (Figure 5). As the lake level dropped in 2001, the area size of all bays also decreased. As a result, the quantity and quality of available habitat for species that use open water spaces was variable through the duration of the study. Bear River Bay showed the greatest decrease in area size between the high and low lake years of 1999 and 2001. At the end of the survey season in 2001, the water surface area was approximately 80 square miles smaller than the same time during the high lake year of 1999.
Figure 5. Changes in bay area sizes with fluctuations in lake elevation.
For three open water bays at Great Salt Lake (Bear River Bay, Ogden Bay, and Farmington Bay), each chart shows variation throughout the survey season (survey periods 1-17) and compares a year of high lake elevation (1999) to a year of low lake elevation (2001).
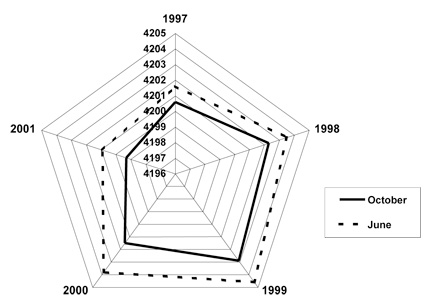
Within Season ChangesThe changes of GSL elevation within survey seasons varied from 0.3 m (1 ft) in 1997 to 0.7 m (2.25 ft) in 2000 (Figure 6). These conditions reflect the vagrant conditions associated with the evaporation period of the annual lake cycle. The average seasonal change for the five-year study was 0.5 m (1.6 ft), which is inside the long-term trend of annual elevation change.
Figure 6. Comparison of GSL high (June) and low (October) elevations, 1997-2001.
Lake elevation values are listed in the column (4196 – 4205) and represent feet above sea level.
The effects of wind on shoreline varied with shoreline type. Winds in excess of 30 mph were experienced each survey season. Where causeways were encountered by wind, the force often caused mixing on the leeward side of culverts. During strong winds, the Antelope Island State Park causeway culverts experienced focused, driving water on the windward side that ballooned through culverts often in excess of 1 km. These conditions were visible because of surface watercolor contrasts. Farmington Bay water is often less green or blue than the denser brines of Gilbert Bay. Vertical mixing of salinities at these culvert sites is unlikely due to the difference in brine densities. Wind effect on low gradient mudflats and sandbars was noted to spread surface water over extensive areas, sometimes for several hundred meters. This phenomenon affected habitat and bird use in several ways. The substrate became moistened, and seemed to increase foraging activity in some cases (Appendix 3). At times invertebrate activity on wet shorelines also increased. Wind tides also drove masses of filamentous algae on to otherwise relatively sterile beaches (e.g., Ogden Bay North; Appendix 4). After these algal biomasses were stranded, they attracted brine flies, and subsequently, birds that foraged on the flies. This condition was noted most often later in the season, after filamentous algal blooms were well developed. Flies and birds used these same algae mats as they floated about the lake. Wind tides caused brine fly pupal chamber residue from hatches to windrow along the shoreline. These windrows offer a nutrient rich mix of algae and adult brine flies on which gulls and other shorebirds concentrate. Wind also distributes organic and inorganic debris along the shoreline. Snowy plovers, stilts and avocets often nest next to wind placed debris. Western sandpipers also roost next to these debris at times in excess of 200 m from the current shoreline. Near shorelines on various islands and elevated bars, gulls use large isolated debris (logs, planks and uprooted brush). Water evacuated from beaches on the leeward side of wind events exposes wet mudflats used by foraging shorebirds and gulls. At other times wind tides inundate nests, causing egg loss or nest desertion. Wind may or may not change the condition of large and small WMA impoundments. In general, the wind effect on managed sites is not as eventful because of their smaller size and emergent vegetation, which act as a buffer. Often, birds use managed sites for shelter during wind events.Survey CoveragePercent of GSL ecosystem covered by Waterbird SurveyFor this report the GSL ecosystem is represented by the GSL and its associated delta-formed wetlands. When the lake is at its long-term historic elevation of 1,281 m (4202' ASL), the lake surface area is 3,885 km2, and the associated emergent marshes and non-vegetated mud flats and salt flats encompass 2,065 km2 (Fretwell et al. 1996). The GSL Waterbird Survey covered approximately 21% of the total GSL area and wetlands, and approximately 27% of wetland habitat important to waterbirds (see Table 4). Table 4. Summary of area sizes of Great Salt Lake bays and wetlands,
*One quarter of area surveyed via plane and results extrapolated for 100% coverage. Coverage within survey areasThe GSL Waterbird Survey covered most of the known waterbird habitat (Figure 1). All of the shoreline from the Bear River Delta south to the Jordan River Delta and west to Stansbury Island was surveyed. Along that same section much of the lake’s associated wetlands was included in survey areas, and a good proportion had survey coverage. Some wetlands known to have waterbird use that were not covered in this study are: Blue Creek complex south of Lampo Junction, Chesapeake Duck Club, Black Marsh, Reeder Overflow, the east extension of Ogden Bay WMA, Sulphur Creek, several clubs within the Associated Duck Clubs region, and ponds cut off from the south end of the lake by InterState 80. These areas were not surveyed because of limited volunteer numbers or restricted access, but in the future should be investigated to determine the extent of waterbird use. Open water areas of Bear River, Ogden and Farmington Bays were surveyed by transects representing approximately 1⁄4 of the total lake surface. Data are missing at several levels of the Waterbird Survey, all of which have been accounted for in the data analyses. In 1997, the first seven survey periods were not surveyed because of unresolved logistical problems. The last survey period (17) was not part of the schedule in 1997, but was added to the following four years to include arriving waterfowl. For some analyses, only four years (1998-2001) of data were used to maintain consistency in comparisons. Five years of data were used for individual species, suites, and survey area comparisons. On the north end of the lake, the managed wetland areas had some survey coverage, and the shoreline and open water were determined unsuitable for waterbird use because of the extreme saline conditions. A portion of the western shoreline south of the railroad causeway was covered by some survey efforts. The land on this side of the lake is used by the US Air Force munitions testing and has highly restricted access. Stansbury Bay has been converted into commercial evaporation ponds, but surveys were conducted between Lakepoint, Badger Island, and Stansbury Island from a dike road. This survey has been important in detecting the presence of large flocks of Wilson’s and red-necked phalaropes on the west side of the lake. Large wetland complexes were not surveyed in their entirety (Table 5). Coverage was limited for many reasons including: difficult access, limited viewing, and large area size. These complexes have been evaluated separately to describe survey coverage. The Waterbird Survey project managers met with site managers and/or survey participants to determine the approximate percent coverage of these areas. The size of the survey area, percent of appropriate waterbird habitat within the area, percent visibility, and the percent of the area actually surveyed were discussed. These coverage estimates were used in calculating densities of waterbird species in the respective area.Between Year Changes in Survey CoverageSurvey coverage did alter between years, usually due to limited numbers of volunteers or restricted access at certain locations. Stansbury Island North (2) had restricted ground access, and was added to the aerial survey route in 1999 but was skipped every third period. Concurrently, the Farmington Bay lake portion coverage was reduced to the alternate flights when Stansbury Island North was not flown; this decision was made due to the low bird counts during parts of the survey season in this large area. Coverage continued through 2001. Audubon Interior (9c) had restricted access until the 2001 season. Locomotive Springs WMA (35) was surveyed in 1997 but not again until 2001 because of limited surveyors and the remote location. Magcorp (40; currently called US Magnesium Corporation of Salt Lake City) was added to the Waterbird Survey in 1998 and efforts continued through 2001. New State Duck Club (41) has limited access and difficult travel conditions. The area was added to the Survey in 1999 and covered by UDWR personnel. In 2000 the area was dropped because of limited UDWR staff, and in 2001, surveyed by a member of the duck club. East Farmington Bay (42) and Deardens Knoll (43) were added to the survey in 1999 and covered through 2001. Jordan River (44) was added to the aerial survey route in 1999 and counted every third period. The survey was dropped in 2001 because low lake elevation left this area dry and unused by waterbirds. Survey coverage within years also had some variation. Most areas were surveyed on a regular basis; counts before and after the gap were averaged to fill in the missing point in cases where a survey period was missed. Occasionally, a survey area was not counted for multiple survey periods. These large gaps in coverage contribute to the conservative nature of these bird counts. For some analyses, incomplete data sets were not used.Table 5. Summary of survey coverage of large wetland complexes associated with GSL.
|