 |
 |
 |
||||||||||||
 |
 |
 |
 |
 |
 |
 |
 |
|||||||
|
Preface • Introduction • Study Objectives • Community Participation • Regional, Physical and Ecological Setting Methods • Survey Protocol • Surveyors • Data Compilation • Data Analysis Results • Migration Chronology • Breeding Species • GSL Species Accounts • Species Distribution Discussion • Recommendations • Acknowledgements • Definitions/Abbreviations • Literature Cited Report & Appendices: 1 • 2 • 3 • 4 • 5 • 6 • 7 • 8 21-Year Waterbird Survey Synopsis & Appendices: 1B • 2B • 4B • 5B • 6B • 8B
|
Survey ProtocolSurveys were conducted every 10 days falling on or close to a designated target date. The first survey season in 1997 started in late June and continued until mid-September with a total of 9 survey periods. Seasons in 1998-2001 had 17 survey periods from April through September. Four survey techniques were used based upon the area type. All data were collected in a format appropriate for analysis at the conclusion of the study. Total Count (TC)In total count areas, all waterbirds seen and heard in the accessible areas of the site were recorded. The number of observers varied based on the survey area demands (e.g., numbers of birds, size of site). Often TC sites were not completely covered because of inaccessibility or the presence of dense, emergent vegetation that obstructed viewing. Most often, standardized travel routes were roadways on top of dikes, and in some areas transects were established. Many of these sites were located in State and Federal wildlife management areas or within the confines of private duck clubs or wildlife preserves. Walking Transect and Point Sample (TC w/ PS)Surveys along the shoreline of the lake were comprised of a walking transect with at least one point sample (Figure 3). Several shoreline areas were surveyed using all-terrain vehicles (ATV) due to their length.
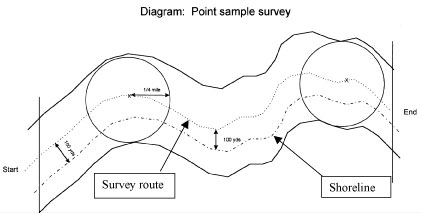
Figure 3. Diagram of shoreline survey protocol. A typical route of a shoreline survey transect
with a point sample parallels the shoreline at a distance of 100 yards. Point samples are centered on the survey route and encompass a circular area of 1/4 mile radius.
Survey routes began at a designated starting point and followed the contours of the shore 100 yards from the waterline (distance estimated by sight). All waterbirds observed within 0.25 mile on either side of the transect line were recorded. Upon reaching a point sample location, the observer began a 10-minute count of all birds within a 0.25-mile radius circular plot. Habitat and behavioral observations were also collected at point sample locations. All birds recorded along the transect, and within the point samples, were treated as a total count; point counts were recorded separately. All point sample locations were chosen in one of two random manners: numbers generated from a random numbers table determined the distance of random point count locations from the designated starting point of the transect; ten percent of all drainage points on the south, east, and north shorelines of the lake were also selected randomly for a point count. Due to the dynamic nature of GSL shorelines, it was determined that point samples should always be centered 100 yards from the shoreline through time. The protocol required that a surveyor move at right angles from the permanently placed sample marker as necessitated by the fluctuating shoreline. At times under these conditions, the point sample marker may be isolated some distance from the shoreline on land, or be surrounded by water during high lake periods. Many of the shoreline areas in the South Arm and Farmington Bay were mapped with Global Positioning System (GPS) equipment.Area Count (AC)One or more area counts were conducted at each of the large State waterfowl management areas (WMA) and the Federal wildlife habitat area (WHA). Survey sites were selected by the area managers based on their management needs. Counts were conducted along manmade impoundments or naturally occurring ponds with an identifiable boundary. The boundary enclosed a measured area from which bird density estimates could be derived. Habitat and behavioral observations were also collected during area counts. In addition to the area counts, birds observed in all other accessible portions of the WMA were recorded, completing a total count of the entire WMA. Aerial Survey (AR)Surveys were conducted from the air to count birds occupying open water in the large bays, and two areas with difficult access: Willard Spur and Stansbury Island, North. Each body of water (Farmington, Ogden and Bear River bays and the Willard Spur) was broken into 0.25-mile wide transects spaced one mile apart. Transects were positioned 0.5 miles from the 1997 shoreline (GSL elevation approximately 4201.10' ASL) to avoid overlap with shoreline surveys. In areas where shorelines were not surveyed (i.e., islands, remote areas, salt evaporation dikes), aerial surveys extended up to the shoreline. An in-plane, GPS was used to locate the predetermined start and finish points of transects. Geo-referenced transects established in 1997 were used throughout the remainder of the five year survey period. To ensure plenty of light flights began around 7:30 am. According to the variety and abundance of waterbirds viewed below, speed of the plane varied but was typically in the range of 80-100 mph. Elevation varied, but the pilot and observers worked at maintaining an elevation of approximately 80-200 feet above the water surface. Two observers identified and counted waterbirds out to 0.125 miles on each side of the plane while noting observations on audiocassette recorders. At the Stansbury Island North site, the airplane followed the shoreline for the length of the transect, and waterbirds were identified and counted out to 0.125 miles on each side of the plane. Transect counts from the three open water bays were extrapolated to the entire bay area in two ways: a general extrapolation was calculated by multiplying counts by four for each survey; a more seasonal specific extrapolation was achieved by calculating an average species density and multiplying it by the surface area of the bay specific to lake elevation at the time of the survey. |