 |
 |
 |
||||||||||||
 |
 |
 |
 |
 |
 |
 |
 |
|||||||
Elevations
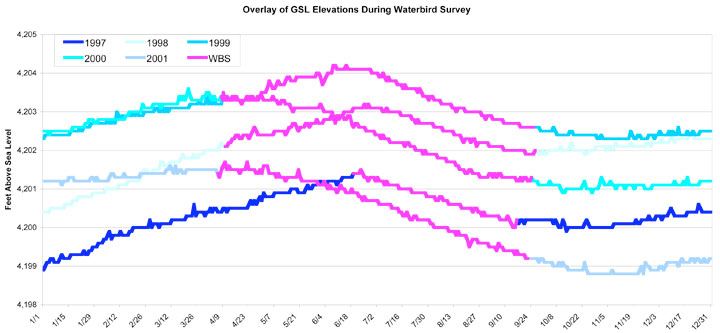
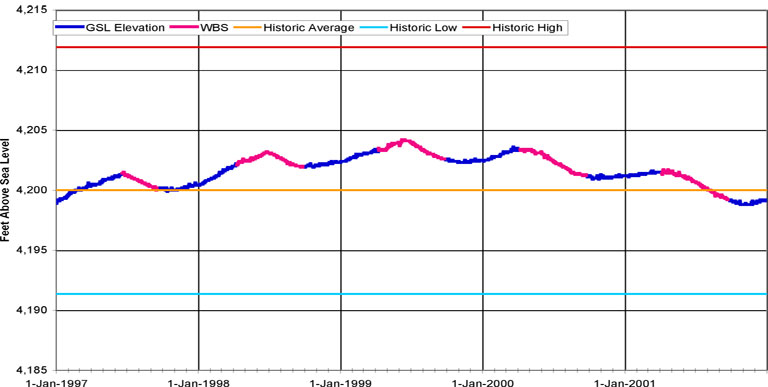
Great Salt Lake Elevation Fluctuations from 1997-2001
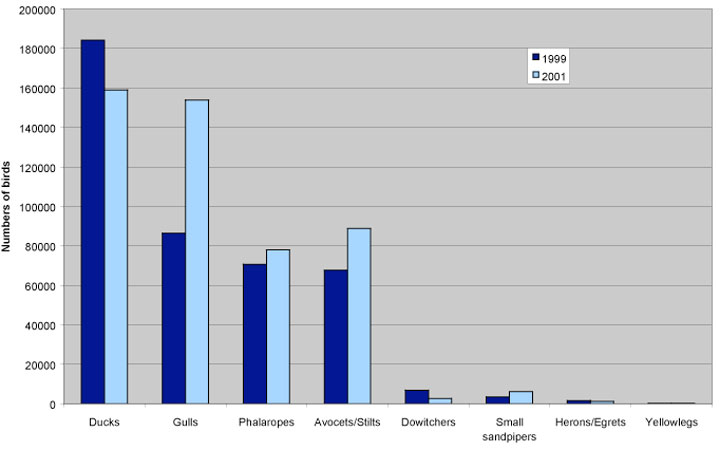
Appendix 3: Habitat Use at High and Low Lake Elevations
The following links display charts reflecting data collected from selected point samples
as part of the protocol for areas classified as “total count with point sample.”
To illustrate varying conditions related to different lake elevations, only data from 1999 and
2001 are included here. During the time frame of this study, the lake elevation reached
its highest point in 1999. In both 1997 and 2001, lake elevations were similarly low,
but data were better collected in the latter year and, therefore, are included in this appendix.
Click the following links to display charts illustrating habitat use during high and low lake elevations for each specific area.
Area 3a - Stansbury Island South (N)
Area 3b - Stansbury Island South (S)
Area 6 - Saltair (3 point samples)
Area 8a - Kennecott Lakeside (3 point samples)
Area 11 - Farmington Bay Lakeside (3 point samples)
Area 15 - Antelope Island West (2 point samples)
Area 18 - West Layton (2 point samples)
Area 34a - East Promontory (3 point samples)
Appendix 8: Species Distribution at High and Low Lake Elevations
Appendix 8 of the GSL Waterbird Survey Report contains groups of maps with the distribution of species by survey periodduring a high lake elevation year (1999) and a low lake elevation year (2001).
These maps are arranged to contrast species use of the available habitat under two very different sets of conditions.
Click on the species below to view comparative distributions during high and low lake elevation years.