 |
 |
 |
||||||||||||
 |
 |
 |
 |
 |
 |
 |
 |
|||||||
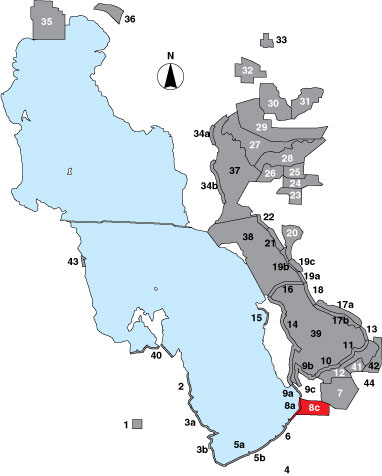
8 Kennecott
Description |
This survey includes the section of shoreline between the old Saltair railroad grade and the Goggin Drain, with two randomly selected point samples and one drainage point sample at the Goggin Drain (8a). In addition a total count survey covers all ponds on the Kennecott Inland Sea Shorebird Reserve (8c). Two independent teams surveyed area 8a. The raw data is separated accordingly in the database (areas 8a and 8b), but for simplicity the data is combined and named area 8a throughout this report. |
Primary Habitat
Area Size (ha) |
8a = 580.3 8c = 2763.2 |
Estimated Area Covered by Survey (ha) |
8a = 580.3 8c = 1105.3 |
Years Surveyed |
5 |
Detection Rates |
Visibility is good for all of the shoreline section except at the Goggin Drain where emergent vegetation blocks a good view of the entire point sample. In 1999, surveyors from the adjacent survey area (9a) began recording half of the point sample that could be seen from the other side of the drain, but the numbers were not kept separately from the rest of the survey at 9a and, therefore, not added in to the Goggin point sample. |
Site Bird Data (8a)
|
Site Bird Data (8c)
|