 |
 |
 |
||||||||||||
 |
 |
 |
 |
 |
 |
 |
 |
|||||||
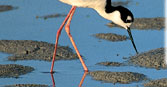
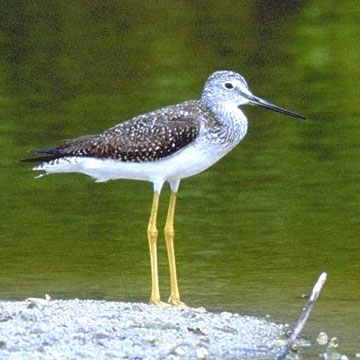
Greater Yellowlegs (GRYE)
 |
|
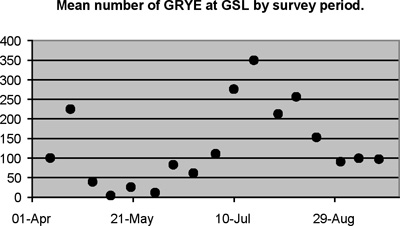
Population Estimates
|
Great Salt Lake
|
|||||
|
Code
|
Global
|
North America
|
Mean
Apr-Sep |
Peak
20-Jul |
High Count
2000 |
Abundance Status
|
| GRYE | 100,000 | 100,000 | 129 | 349 | 555 | C |
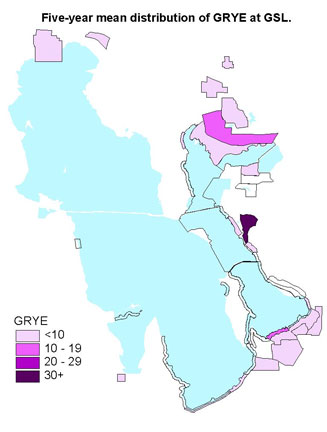
| Click a survey area number on the map above or an area from the list below to view the survey area data by year for this species. |
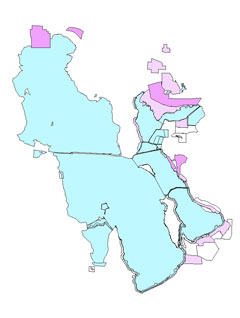
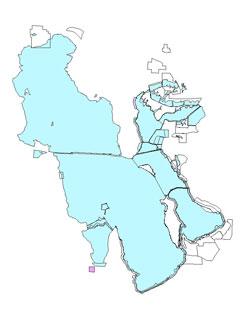
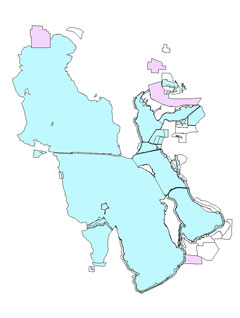
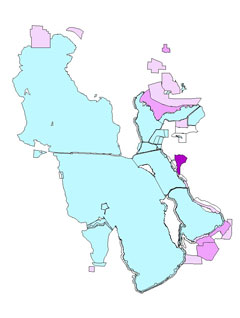
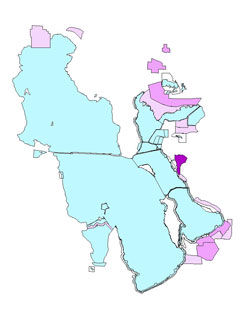
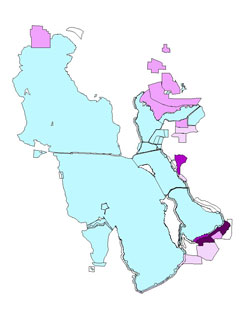
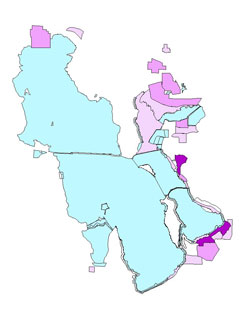
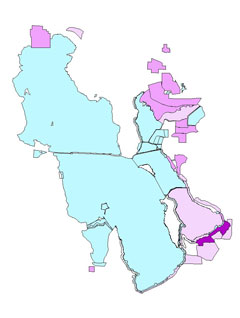
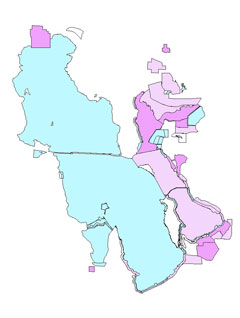
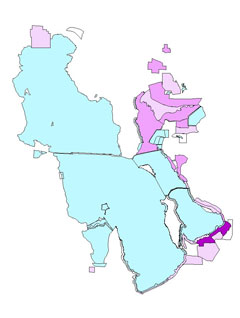
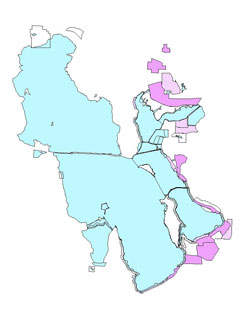
Areas of Importance by Survey Period
(Distribution of GRYE and LEYE)
(Note: The following distribution charts represent the combined survey of Greater AND Lesser Yellowlegs.)
|
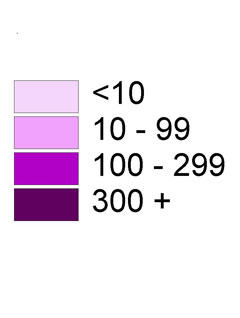
Numbers of GRYE
|
Period 1: April 6-15
|
Period 2: April 16-25
|
 |
 |
 |
|
Period 3: April 26-May 5
|
Period 4: May 6-15
|
Period 5: May 16-25
|
 |
 |
 |
|
Period 6: May 26-June 4
|
Period 7: June 5-14
|
Period 8: June 15-24
|
 |
 |
 |
|
Period 9: June 25-July 4
|
Period 10: July 5-14
|
Period 11: July 15-24
|
 |
 |
 |
|
Period 12: July 25-Aug 3
|
Period 13: Aug 4-13
|
Period 14: Aug 14-23
|
 |
 |
 |
|
Period 15: Aug 24-Sep 2
|
Period 16: Sep 3-12
|
Period 17: Sep 13-22
|
 |
 |
 |