Official Utah websites use utah.gov in the browser's address bar. A Utah.gov website belongs to an official government organization in the state of Utah.
Be careful when sharing sensitive information. Share sensitive information only on secure official Utah.gov websites.
An official website of the state of Utah. Here's how you know:
Official Utah websites use utah.gov in the browser's address bar. A Utah.gov website belongs to an official government organization in the state of Utah.
Be careful when sharing sensitive information. Share sensitive information only on secure official Utah.gov websites.
Since 2018, the Utah Division of Wildlife Resources has not conducted aerial swan surveys at the Great Salt Lake. Because swan migration is very consistent over time, swan hunters can anticipate that swans will be in the same locations during the same time period from year to year.
Average migration numbers
The data below shows swan migration patterns over the last 60 years. Swan migration has varied very little from year to year. Most swans show up in Utah around the first of November and stay until the first hard freeze. The Bear River Refuge and surrounding marshes are where most swans stop on their migration.
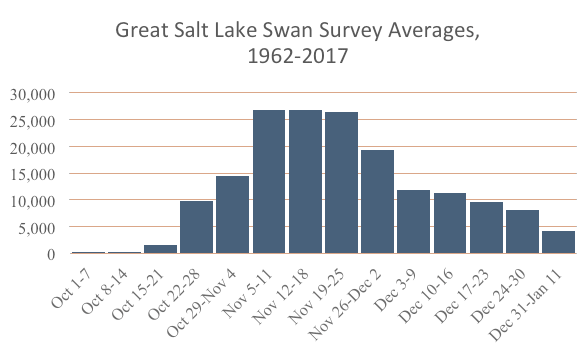
By week
The following chart shows the average number of swans observed migrating at locations around the Great Salt Lake during each week of the waterfowl hunting seasons from 1962 to 2018, based on survey data:
Great Salt Lake swan survey averages, 1962-2018
By location
The following chart shows the percentage of time swans spent in each area during migration, based on surveys between 1962 and 2018:
Migration time per location, 1962-2018
Archived swan survey results
View the swan surveys for the following seasons:
Table showing number of swans migrating through various locations on different dates during the 2017-18 season
Location
Oct. 4
Oct. 11
Oct. 18
Oct. 25
Nov. 1
Nov. 8
Nov. 15
Nov. 22
Nov. 29
Dec. 6
Dec. 13
S. Shore Clubs
50
1,390
4,120
4,100
2,960
Farmington Bay
25
500
Layton-Kaysville
Howard Slough
20
1,025
300
236
Ogden Bay
Harold Crane
105
3,335
625
185
Willard Spur / BRR below D Line
160
504
405
825
1,750
Bear River Refuge Unit 1
20
85
4,995
9,510
18,030
21,073
17,145
3,905
Bear River Refuge Unit 2
10
5
Bear River Refuge Unit 3
15
80
283
3,375
860
Bear River Refuge Unit 4
410
375
3,960
3,035
2,370
Bear River Refuge Unit 5
10
910
3,035
3,385
2,430
675
Bear River / Davis Club
730
14,550
29,440
10,795
11,310
6,435
Chesapeake Club & vicinity
10
200
965
535
730
785
Public Shooting Grounds
50
90
1,783
2,155
1,140
1,247
Salt Creek / Sage Brush Club
60
1,100
1,760
Promontory / WBRB
10
202
Total
20
85
5,805
26,080
61,097
49,601
44,390
21,610
Table showing number of swans migrating through various locations on different dates during the 2016-17 season
Location
Oct. 4
Oct. 11
Oct. 18
Oct. 25
Nov. 1
Nov. 8
Nov. 15
Nov. 22
Nov. 29
Dec. 6
Dec. 13
S. Shore Clubs
525
3,550
2,146
1,742
Farmington Bay
1
1
Layton-Kaysville
Howard Slough
1
4,030
1,135
503
Ogden Bay
545
507
Harold Crane
5
120
140
50
Willard Spur / BRR below D Line
195
1,025
1,505
4,040
Bear River Refuge Unit 1
1,261
9,575
17,765
8,655
5,015
Bear River Refuge Unit 2
8
Bear River Refuge Unit 3
5
590
255
484
Bear River Refuge Unit 4
575
750
835
310
Bear River Refuge Unit 5
5
210
385
895
922
1,037
Bear River / Davis Club
102
2,105
3,512
17,785
12,410
8,670
3,781
Chesapeake Club & vicinity
585
1,425
463
1,237
Public Shooting Grounds
13
515
3,400
772
421
Salt Creek / Sage Brush Club
275
180
60
585
Promontory / WBRB
5
Total
107
2,315
4,787
30,976
46,141
25,558
19,720
Table showing number of swans migrating through various locations on different dates during the 2015-16 season
Location
Oct. 6
Oct. 13
Oct. 20
Oct. 27
Nov. 3
Nov. 10
Nov. 17
Nov. 24
Dec. 1
Dec. 8
Dec. 15
S. Shore Clubs
2,951
3,765
5,545
1,360
Farmington Bay
5
25
Layton-Kaysville
Howard Slough
50
215
610
1
Ogden Bay
455
705
10
Harold Crane
17
575
275
25
Willard Spur / BRR below D Line
35
25
255
1,805
970
Bear River Refuge Unit 1
900
7,050
1,060
6,170
8,367
4,495
1,725
Bear River Refuge Unit 2
15
Bear River Refuge Unit 3
50
4,070
4,489
1,580
745
Bear River Refuge Unit 4
730
593
75
Bear River Refuge Unit 5
12,540
809
1,095
845
1,555
Bear River / Davis Club
245
1,557
1,850
11,810
14,035
2,686
3,765
315
Chesapeake Club & vicinity
95
855
805
1,600
Public Shooting Grounds
174
565
1,620
1,466
1,495
70
Salt Creek / Sage Brush Club
20
825
895
535
30
Promontory / WBRB
Total
0
245
2,457
9,074
26,175
32,549
25,221
23,335
6,831
Table showing number of swans migrating through various locations on different dates during the 2014-15 season
Location
Oct. 7
Oct. 14
Oct. 21
Oct. 28
Nov. 4
Nov. 11
Nov. 18
Nov. 25
Dec. 2
Dec. 9
Dec. 16
S. Shore Clubs
1,285
1,630
Farmington Bay
35
5
94
Layton-Kaysville
Howard Slough
5
Ogden Bay
35
563
Harold Crane
15
100
35
Willard Spur / BRR below D Line
35
1,540
1,085
Bear River Refuge Unit 1
360
315
7,995
785
1,975
Bear River Refuge Unit 2
685
224
Bear River Refuge Unit 3
55
295
1,520
Bear River Refuge Unit 4
250
70
120
355
1,930
Bear River Refuge Unit 5
140
131
Bear River / Davis Club
177
255
1,195
3,905
11,775
8,400
Chesapeake Club & vicinity
5
5
20
1,065
285
Public Shooting Grounds
20
7
510
385
388
Salt Creek / Sage Brush Club
5
185
425
Promontory / WBRB
485
Total
0
197
870
1,597
12,690
No count
19,125
No count
18,685
Table showing number of swans migrating through various locations on different dates during the 2013-14 season
Location
Oct. 1
Oct. 8
Oct. 15
Oct. 22
Oct. 29
Nov. 5
Nov. 12
Nov. 19
Nov. 26
Dec. 4
Dec. 10
Dec. 17
S. Shore Clubs
895
1,425
1,515
380
Farmington Bay
373
Layton-Kaysville
27
70
Howard Slough
65
11
Ogden Bay
50
Harold Crane
5
12
25
Willard Spur / BRR below D Line
63
130
33
30
28
Bear River Refuge Unit 1
2,020
2,975
8,090
16,175
10,154
2,135
450
Bear River Refuge Unit 2
125
35
Bear River Refuge Unit 3
15
355
760
9,586
3,890
1,155
Bear River Refuge Unit 4
30
10
2,290
161
40
200
Bear River Refuge Unit 5
50
55
550
250
Bear River / Davis Club
40
4,480
3,540
13,015
13,810
11,585
3,685
1,470
Chesapeake Club & vicinity
13
695
501
405
130
Public Shooting Grounds
40
115
350
305
290
455
135
Salt Creek / Sage Brush Club
255
120
103
40
Promontory / WBRB
Total
No count
0
40
6,540
6,675
22,201
35,507
33,861
13,148
Table showing number of swans migrating through various locations on different dates during the 2012-13 season
Location
Oct. 2
Oct. 9
Oct. 16
Oct. 23
Oct. 30
Nov. 6
Nov. 13
Nov. 20
Nov. 27
Dec. 4
Dec. 11
S. Shore Clubs
2,205
5,678
4,566
3,039
1,293
1,891
Farmington Bay
2
1,513
80
5
186
Layton-Kaysville
62
95
43
82
12
4
Howard Slough
120
328
7
4
Ogden Bay
190
120
2,895
731
34
158
Harold Crane
388
25
237
367
41
85
Willard Spur / BRR below D Line
660
822
835
110
401
192
Bear River Refuge Unit 1
110
3,102
2,380
2,370
1,616
420
1,102
Bear River Refuge Unit 2
0
3
17
0
310
84
Bear River Refuge Unit 3
500
1,185
594
484
385
235
Bear River Refuge Unit 4
730
83
522
725
97
295
Bear River Refuge Unit 5
71
8
11
175
177
159
Bear River / Davis Club
5,365
3,853
2,110
1,052
1,335
617
Chesapeake Club & vicinity
277
492
589
157
52
12
Public Shooting Grounds
423
734
793
260
223
207
Salt Creek / Sage Brush Club
595
10
165
207
14
10
Promontory / WBRB
Total
No count
0
110
No count
14,690
15,816
17,260
9,085
4,806
5,241
Table showing number of swans migrating through various locations on different dates during the 2011–12 season
Location
Oct. 4
Oct. 11
Oct. 18
Oct. 25
Nov. 2
Nov. 8
Nov. 15
Nov. 22
Nov. 29
Dec. 6
Dec. 13
S. Shore Clubs
433
3,467
1,182
1,382
225
Farmington Bay
20
105
Layton-Kaysville
13
542
403
Howard Slough
5
9
923
2
5
Ogden Bay
5
2
Harold Crane
25
120
3
Willard Spur / BRR below D Line
45
752
1,980
5,827
603
1,546
Bear River Refuge Unit 1
1
603
2,204
11,244
19,533
28,111
19,296
4,147
230
Bear River Refuge Unit 2
995
Bear River Refuge Unit 3
5
624
2,241
191
40
Bear River Refuge Unit 4
268
898
3,396
6,216
1,647
68
Bear River Refuge Unit 5
2
260
774
1,461
3,977
1,442
Bear River / Davis Club
316
4,870
10,766
19,256
7,228
9,782
5,110
816
Chesapeake Club & vicinity
5
925
171
1,153
2,059
263
Public Shooting Grounds
8
374
668
584
448
613
Salt Creek / Sage Brush Club
300
72
293
201
4
Promontory / WBRB
Total
No count
1
919
7,084
22,702
43,060
46,549
49,364
20,346
5,744
No flight
Table showing number of swans migrating through various locations on different dates during the 2010-11 season
Location
Oct. 5
Oct. 12
Oct. 19
Oct. 26
Nov. 2
Nov. 9
Nov. 16
Nov. 23
Nov. 30
Dec. 7
Dec. 14
S. Shore Clubs
48
250
1,816
7,041
1,290
1,745
Farmington Bay
685
Layton-Kaysville
72
Howard Slough
385
45
Ogden Bay
2
Harold Crane
291
822
2
Willard Spur / BRR below D Line
8
3,230
4,202
3,619
95
Bear River Refuge Unit 1
231
2,843
8,234
6,891
9,988
661
1,340
Bear River Refuge Unit 2
Bear River Refuge Unit 3
100
Bear River Refuge Unit 4
48
107
275
110
50
Bear River Refuge Unit 5
60
303
Bear River / Davis Club
693
1,298
2,522
7,831
10,533
645
240
Chesapeake Club & vicinity
20
5
6
269
689
Public Shooting Grounds
69
444
845
1,062
147
Salt Creek / Sage Brush Club
3
1,891
105
4
Promontory / WBRB
Total
947
4,319
14,793
24,756
34,186
No Count
3,283
No Count
3,926
Table showing number of swans migrating through various locations on different dates during the 2009-10 season
Location
Sept. 29
Oct. 6
Oct. 13
Oct. 20
Oct. 28
Nov. 3
Nov. 10
Nov. 17
Nov. 24
Dec. 1
Dec. 11
Dec. 16
Dec. 24
Dec. 30
Jan. 6
Mar. 17
S. Shore Clubs
0
1
35
144
164
2,195
3,085
411
Farmington Bay
Layton-Kaysville
4
Howard Slough
1
Ogden Bay
27
Harold Crane
13
29
2
163
Willard Spur / BRR below D Line
1,124
3,490
4,607
9,357
2,400
Bear River Refuge Unit 1
650
1,547
3,560
16,186
17,218
1,232
14,172
9,620
700
Bear River Refuge Unit 2
12
15
370
206
Bear River Refuge Unit 3
10
475
57
Bear River Refuge Unit 4
629
1,255
1,620
3,055
4,038
100
Bear River Refuge Unit 5
165
216
800
Bear River / Davis Club
7
456
2,922
5,605
5,801
9,750
27,700
10,488
10,741
425
Chesapeake Club & vicinity
225
961
1,595
1,358
1,014
2
Public Shooting Grounds
15
15
616
1,252
1,308
463
634
Salt Creek / Sage Brush Club
102
99
555
1,243
620
2
Promontory / WBRB
Total
0
7
1,122
4,469
9,180
23,606
31,826
37,739
38,593
39,752
4,840
Table showing number of swans migrating through various locations on different dates during the 2008-09 season
Location
Oct. 1
Oct. 7
Oct. 14
Oct. 21
Oct. 28
Nov. 4
Nov. 11
Nov. 18
Nov. 25
Dec. 2
Dec. 9
Dec. 16
Dec. 23
Dec. 30
Jan. 6
Mar. 17
S. Shore Clubs
565
3,102
2,170
4,385
6,505
4,337
Farmington Bay
Layton-Kaysville
5
5
Howard Slough
1,173
1,425
Ogden Bay
7
40
155
Harold Crane
30
10
Willard Spur / BRR below D Line
675
715
3,315
3,880
3,706
4,554
Bear River Refuge Unit 1
127
4,744
17,739
23,215
26,798
26,030
9,600
11,758
2,268
Bear River Refuge Unit 2
2
350
Bear River Refuge Unit 3
314
1,145
275
200
Bear River Refuge Unit 4
1,528
746
850
3,040
2,430
4,352
2,974
Bear River Refuge Unit 5
8
185
55
110
275
140
Bear River / Davis Club
60
1,470
6,844
2,329
21,023
10,035
11,458
9,457
5,380
Chesapeake Club & vicinity
134
125
500
644
2,915
890
1,580
Public Shooting Grounds
62
677
616
456
822
649
420
55
Salt Creek / Sage Brush Club
3
1,130
1,200
10
295
Promontory / WBRB
23
Total
0
0
187
6,284
27,361
28,271
54,776
47,556
37,853
37,578
23,528
Table showing number of swans migrating through various locations on different dates during the 2007-08 season
Location
Sept. 25
Oct. 3
Oct. 9
Oct. 16
Oct. 23
Oct. 30
Nov. 6
Nov. 15
Nov. 20
Nov. 27
Dec. 4
Dec. 13
Dec. 18
Dec. 25
Jan. 1
Mar. 7
S. Shore Clubs
1,408
2,828
5,689
6,575
2,850
770
1,560
Farmington Bay
75
78
1,285
955
Layton-Kaysville
11
110
1
35
Howard Slough
250
95
80
3
25
Ogden Bay
99
785
550
210
Harold Crane
352
400
20
229
140
160
Willard Spur / BRR below D Line
47
46
325
178
265
746
Bear River Refuge Unit 1
1,057
6,769
13,803
21,914
10,134
666
416
60
1,474
Bear River Refuge Unit 2
152
405
800
322
Bear River Refuge Unit 3
30
2
144
80
140
937
6
Bear River Refuge Unit 4
148
156
1,422
2,601
2,480
1,850
2,574
425
305
Bear River Refuge Unit 5
4
798
723
860
662
673
199
125
Bear River / Davis Club
1,697
5,983
10,312
14,244
8,407
7,534
4,517
1,057
690
Chesapeake Club & vicinity
52
709
1,630
1,295
988
1,394
290
260
Public Shooting Grounds
2
161
2,022
696
2,227
291
215
50
20
Salt Creek / Sage Brush Club
20
60
376
500
415
65
92
Promontory / WBRB
20
Total
No survey
No survey
No survey
2
2,936
13,121
30,906
45,221
32,432
19,652
14,991
6,531
6,950
Table showing number of swans migrating through various locations on different dates during the 2006-07 season
Location
Sept. 26
Oct. 3
Oct. 10
Oct. 17
Oct. 24
Oct. 31
Nov. 7
Nov. 16
Nov. 21
Nov. 28
Dec. 5
Dec. 12
Dec. 19
Dec. 26
Jan. 2
Mar. 30
S. Shore Clubs
29
2,354
6,078
7,106
Farmington Bay
60
37
Layton-Kaysville
Howard Slough
Ogden Bay
16
75
415
88
Harold Crane
18
88
234
700
Willard Spur / BRR below D Line
22
80
206
906
5,554
474
Bear River Refuge Unit 1
8,552
13,535
28,424
16,399
7,468
Bear River Refuge Unit 2
1,417
4,025
1,954
1,425
Bear River Refuge Unit 3
6
7
2,172
965
2,257
Bear River Refuge Unit 4
1,043
12
2,195
2,330
2,060
Bear River Refuge Unit 5
25
1,052
1,895
2,442
Bear River / Davis Club
89
6,569
23,147
9,308
12,661
8,593
Chesapeake Club & vicinity
12
92
546
90
Public Shooting Grounds
24
1,650
573
643
144
Salt Creek / Sage Brush Club
58
1,169
322
734
Promontory / WBRB
Total
No survey
No survey
22
89
16,274
40,132
52,493
50,033
33,581
Table showing number of swans migrating through various locations on different dates during the 2005-06 season
Location
Sept. 27
Oct. 4
Oct. 11
Oct. 18
Oct. 26
Nov. 1
Nov. 8
Nov. 16
Nov. 22
Nov. 30
Dec. 8
Dec. 14
Dec. 21
Dec. 28
Jan. 3
Mar. 15
S. Shore Clubs
No survey
No survey
No survey
3
21
55
No survey
3,305
1,981
Farmington Bay
38
Layton-Kaysville
Howard Slough
25
10
Ogden Bay
105
255
130
Harold Crane
316
1,202
515
Willard Spur / BRR below D Line
8
1,005
2,165
3,659
Bear River Refuge Unit 1
5,455
15,073
14,848
21,215
16,680
7,850
Bear River Refuge Unit 2
230
2,155
Bear River Refuge Unit 3
10
5
195
Bear River Refuge Unit 4
161
505
703
2,486
4,160
2,214
Bear River Refuge Unit 5
1,630
1,690
Bear River / Davis Club
365
3,478
2,165
2,621
12,847
21,129
16,008
Chesapeake Club & vicinity
250
2,455
2,524
Public Shooting Grounds
18
108
113
781
182
125
Salt Creek / Sage Brush Club
94
750
No survey
Promontory / WBRB
Total
0
0
0
356
9,125
17,864
18,306
39,412
54,153
38,851
Table showing number of swans migrating through various locations on different dates during the 2004-05 season
Location
Sept. 28
Oct. 4
Oct. 12
Oct. 19
Oct. 26
Nov. 2
Nov. 9
Nov. 16
Nov. 23
Nov. 30
Dec. 8
Dec. 14
Dec. 21
Dec. 28
Jan. 6
S. Shore Clubs
No survey
5
0
No survey
6
129
81
Fogged out
1,487
1,606
1,167
Farmington Bay
0
1
1
Fogged out
37
61
3
Layton-Kaysville
0
Howard Slough
0
202
260
Ogden Bay
0
6
183
553
285
Harold Crane
0
7
267
16
175
323
3
Willard Spur / BRR below D Line
0
243
1,279
1,573
1,488
3,510
Bear River Refuge Unit 1
0
6
5,278
14,691
19,205
16,957
13,533
2,107
105
Bear River Refuge Unit 2
0
890
Bear River Refuge Unit 3
0
5
9
Bear River Refuge Unit 4
0
430
1,328
1,323
1,307
182
Bear River Refuge Unit 5
0
30
115
1,603
325
1,082
330
Bear River / Davis Club
0
252
8,956
18,333
7,343
15,974
8,430
7,764
3,700
Chesapeake Club & vicinity
0
142
240
812
84
440
415
Public Shooting Grounds
0
395
334
43
280
491
8
No survey
Salt Creek / Sage Brush Club
0
3
27
67
12
470
76
No survey
Promontory / WBRB
0
Total
5
258
14,646
34,196
27,541
38,431
28,470
17,645
9,697
Table showing number of swans migrating through various locations on different dates during the 2003-04 season
Location
Sept. 30
Oct. 7
Oct. 14
Oct. 21
Oct. 28
Nov. 4
Nov. 11
Nov. 18
Nov. 25
Dec. 2
Dec. 9
Dec. 16
Dec. 23
Jan. 6
Mar. 15
S. Shore Clubs
No flight
0
0
0
0
No survey
1,889
2,784
2,595
No survey
2,093
3,895
No survey
1,670
Farmington Bay
0
0
0
0
0
230
150
59
1,388
35
Layton-Kaysville
0
0
0
0
298
34
0
20
0
0
Howard Slough
0
0
0
0
952
1,648
0
0
8
Ogden Bay
0
0
0
0
1,811
1,515
390
215
326
620
Harold Crane
0
0
0
681
41
215
0
47
420
Willard Spur / BRR below D Line
0
0
0
0
737
1,976
610
15
5
Bear River Refuge Unit 1
0
20
20
2,814
8,464
4,943
1,100
2,355
0
1,080
Bear River Refuge Unit 2
0
0
0
0
0
0
0
0
Bear River Refuge Unit 3
0
0
0
0
0
2
0
0
Bear River Refuge Unit 4
0
0
0
0
1,728
2,291
6
110
65
93
Bear River Refuge Unit 5
0
0
0
694
700
863
712
423
195
435
Bear River / Davis Club
0
0
621
6,940
9,624
10,601
10,902
3,431
5,804
2,095
Chesapeake Club & vicinity
0
0
0
1,274
1,461
1,376
0
200
116
73
Public Shooting Grounds
0
0
4
366
1,525
1,420
54
312
317
Salt Creek / Sage Brush Club
0
0
0
56
591
368
0
30
918
Promontory / WBRB
0
0
0
0
0
0
0
Total
0
20
645
12,825
29,821
30,266
16,519
9,310
13,457
6,101
Table showing number of swans migrating through various locations on different dates during the 2002-03 season
Location
Oct. 1
Oct. 8
Oct. 15
Oct. 22
Oct. 29
Nov. 5
Nov. 12
Nov. 19
Nov. 26
Dec. 3
Dec. 10
Dec. 17
Dec. 24
Jan. 2
Mar. 15
S. Shore Clubs
No flight
0
0
0
0
10
87
548
816
No flights, fogged out
No flights, fogged out
Farmington Bay
0
0
0
0
0
0
0
0
Layton-Kaysville
0
0
0
0
0
0
0
0
Howard Slough
0
0
0
0
3
3
3
3
Ogden Bay
0
0
0
0
18
30
15
126
2
245
Harold Crane
0
0
0
61
343
0
48
63
210
113
Willard Spur / BRR below D Line
0
0
0
126
2
8
375
1,305
765
3,738
Bear River Refuge Unit 1
0
806
4,296
10,710
5,950
17,203
11,635
7,151
9,511
7,304
Bear River Refuge Unit 2
0
0
0
0
1
0
0
0
0
150
Bear River Refuge Unit 3
0
0
0
0
0
0
0
0
0
Bear River Refuge Unit 4
0
0
27
65
27
701
3,110
2,375
1,725
101
Bear River Refuge Unit 5
0
0
30
165
150
687
461
385
617
59
Bear River / Davis Club
0
1,459
5,859
6,189
23,719
9,416
12,086
8,959
5,011
4,722
Chesapeake Club & vicinity
0
0
0
28
1,347
1,615
2,935
2,401
1,675
892
Public Shooting Grounds
0
0
30
195
592
146
265
303
274
1
Salt Creek / Sage Brush Club
0
0
0
0
135
7
0
566
—
0
Promontory / WBRB
0
0
0
0
4
0
0
0
0
0
Total
0
2,265
10,242
17,539
32,301
29,903
31,481
24,453
19,885
18,933
Table showing number of swans migrating through various locations on different dates during the 2001-02 season
Location
Oct. 3
Oct. 10
Oct. 17
Oct. 24
Oct. 31
Nov. 7
Nov. 14
Nov. 21
Nov. 28
Dec. 5
Dec. 12
Dec. 19
Dec. 26
Jan. 2
Mar. 13
S. Shore Clubs
NA
NA
0
0
0
0
0
0
123
No flight
No flight
No flight
Farmington Bay
NA
0
3
0
3
0
3
0
Layton-Kaysville
NA
0
0
0
0
0
0
0
Howard Slough
NA
0
0
0
0
0
0
0
Ogden Bay
0
0
0
0
0
0
1
13
Harold Crane
0
0
0
0
0
Fogged
0
79
Willard Spur / BRR below D Line
0
0
0
0
0
Fogged
22
1,380
Bear River Refuge Unit 1
0
642
1,541
4,900
11,474
14,350
12,137
2,456
Bear River Refuge Unit 2
0
0
0
0
0
0
0
Bear River Refuge Unit 3
0
0
0
0
0
0
0
Bear River Refuge Unit 4
0
0
0
192
13
275
339
Bear River Refuge Unit 5
0
2
445
271
131
2,138
564
Bear River / Davis Club
0
242
2,783
1,645
5,719
8,584
9,240
9,467
Chesapeake Club & vicinity
0
10
12
190
1,360
1,781
4,294
Public Shooting Grounds
0
2
0
38
451
308
123
438
Salt Creek / Sage Brush Club
0
0
0
2
0
0
150
Promontory / WBRB
0
0
0
0
0
0
1
Total
0
0
886
4,339
7,040
18,302
24,746
25,720
19,304
14,930
No flight
No flight
No flight
2,045
24,734
Table showing number of swans migrating through various locations on different dates during the 2000-01 season
Location
Oct. 3
Oct. 18
Oct. 25
Nov. 1
Nov. 8
Nov. 14
Nov. 22
Nov. 28
Dec. 5
Dec. 13
Dec. 19
Dec. 27
Jan. 11
Mar. 15
S. Shore Clubs
6
2
219
2,916
851
1,632
1,671
NA
1,875
1,261
590
1,599
Farmington Bay
73
107
35
184
52
170
311
1,189
Layton-Kaysville
3
Howard Slough
4
Ogden Bay
693
2,155
994
1,125
1,650
1,028
1,090
1,700
192
3,424
Harold Crane
2
474
288
159
461
457
625
80
2,277
Willard Spur / BRR below D Line
19
295
804
848
1,461
659
728
505
572
55
1,109
Bear River Refuge Unit 1
484
1,601
3,556
3,571
1,714
13
1,179
220
50
485
Bear River Refuge Unit 2
4
336
1,126
70
132
39
85
Bear River Refuge Unit 3
Bear River Refuge Unit 4
49
555
697
1,350
750
26
1
Bear River Refuge Unit 5
4
4
3
110
Bear River / Davis Club
2
730
3,225
5,494
7,255
5,278
7,376
6,827
5,459
7,294
3,311
266
3,457
Chesapeake Club & vicinity
3
10
75
560
588
92
568
340
25
1,659
Public Shooting Grounds
220
1,220
1,209
844
5
78
86
1,538
Salt Creek / Sage Brush Club
356
1,122
197
5
72
45
945
Promontory / WBRB
Total
2
1,269
5,073
12,731
21,423
12,619
11,489
12,309
10,836
12,347
7,399
2,035
17,197
Table showing number of swans migrating through various locations on different dates during the 1995-99 season