Official Utah websites use utah.gov in the browser's address bar. A Utah.gov website belongs to an official government organization in the state of Utah.
Be careful when sharing sensitive information. Share sensitive information only on secure official Utah.gov websites.
An official website of the state of Utah. Here's how you know:
Official Utah websites use utah.gov in the browser's address bar. A Utah.gov website belongs to an official government organization in the state of Utah.
Be careful when sharing sensitive information. Share sensitive information only on secure official Utah.gov websites.
Charts, by season, of cyst sample life stages and total cysts harvested
The brine shrimp harvest industry in the Great Salt Lake has been valued at $10 to $60 million, depending on the quality and quantity of brine shrimp cysts harvested. Just as brine shrimp are dependent upon the lake's functioning environment for survival, so are the harvest companies as well. As of 2026, 21 companies are now harvesting brine shrimp in the north and south arms of the lake.
Commercial harvesting of brine shrimp from the Great Salt Lake began in 1950. Today, the terms and conditions for harvesting are established by a DWR administrative rule:
Administrative Rule R657-52: Commercial harvesting of brine shrimp and brine shrimp eggs, including the permitting of harvesting companies.
As stated in the rule, companies wishing to harvest shrimp in the Great Salt Lake must purchase a Certificate of Registration (COR) annually. Seventy-nine Certificates of Registration are available to purchase each year.
The Utah Division of Wildlife Resources regulates the harvest and ensures a viable shrimp population by allowing a sufficient number of cysts to repopulate the lake each spring. The estimated minimum cyst number is currently 21 cysts per liter at the end of each harvest season.
Harvest procedure
Over time, winds and wave action will pile brine shrimp cysts on beaches. The original harvest method was to rake, shovel, bag and then transport cyst piles by ATVs to waiting trucks or boats. This method still accounts for a large proportion of the total product taken from the Great Salt Lake.
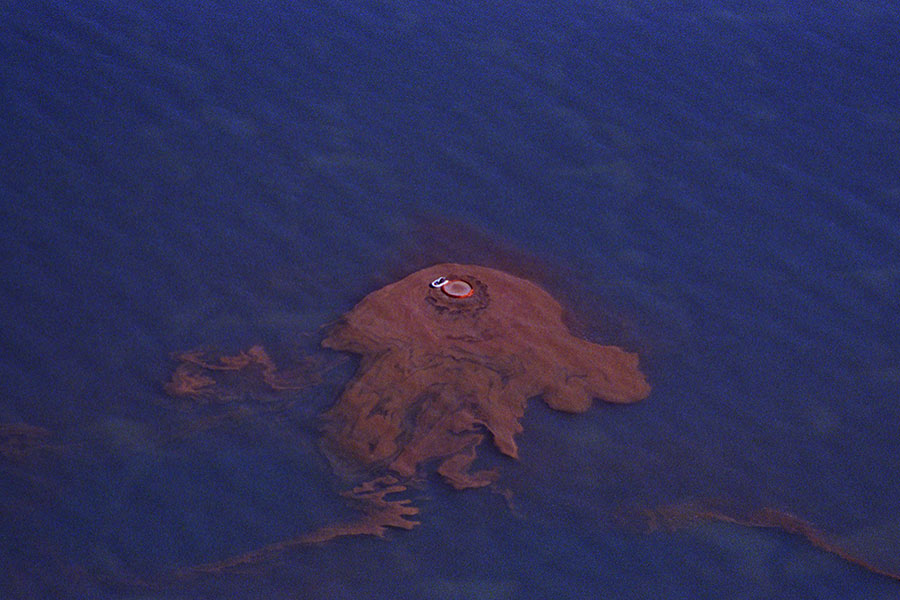
Another harvest method is to use large floating mats to accumulate cysts in the water. These mats are referred to as "streaks" or "slicks," and some are large enough to be seen from space.
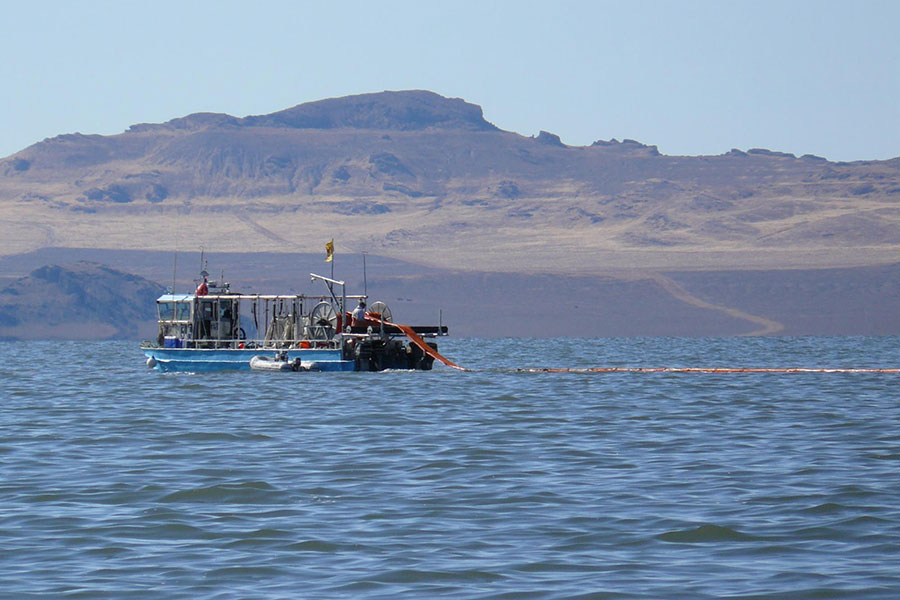
To find a suitable area to harvest, a spotter airplane will fly over the lake, identifying the streaks that are full of cysts and recording their coordinates. The pilot will then radio the coordinates to the harvester boats, which will quickly move to the streaks and then display bright orange-lettered or numbered buoys to claim an area.
Harvesters will then encircle the streak by deploying a floating containment device very similar to an oil containment boom. The cysts within the streak are then condensed into very small hoops, and vacuum pumps pump the cysts into 2,000-pound capacity mesh bags that rest on the deck of the harvester boat.
The contents of these bags are called "raw product," and they must be washed in order to remove any broken shells, feathers or other debris. Additional processing of cysts prior to selling them on the marketplace involves a period of cold storage, washing them with freshwater to remove salt and other debris, drying them and vacuum sealing them in various containers. Once they are fully processed, they are graded based on their hatch rates and sold at different prices based on their grade quality.
As the brine shrimp industry has expanded, technology has as well. Advances in communication, Global Positioning Systems, night vision and spotter airplanes, as well as 20-hour or longer harvest days, have increased the efficiency of the harvest by at least four times. In other words, companies today are able to collect four times the weight of cysts compared to when they started in 1950.
Harvest seasons usually begin in October and end in January, as mandated in the DWR Administrative Rule. The DWR conducts regular sampling runs in the Great Salt Lake during each harvest season to monitor the brine shrimp population, and compiles reports of the commercial harvest totals.
Historical harvest totals: View annual totals of brine shrimp harvest totals dating back to the 1985-86 season.
Here are the harvest summaries, by season:
2025-26 harvest seasonCollapse submenu
Sampling run data
Sorted by brine shrimp sex and life stage. Values are per liter of lake water.
Brine shrimp sampling run summary for the 2025-26 harvest season
Date
Cysts
Nauplii
Juveniles
Males
Total females
Females
Females with eggs/naups
Females with cysts
Feb. 2, 2026
21.35
0.17
0.00
0.01
0.02
0.02
0.00
0.00
Jan. 26, 2026
38.78
0.27
0.00
0.02
0.02
0.02
0.00
0.00
Jan. 20, 2026
16.95
0.25
0.02
0.05
0.05
0.05
0.00
0.00
Jan. 12, 2026
46.43
0.53
0.10
0.18
0.17
0.15
0.02
0.00
Jan. 12, 2026
Jan. 6, 2026
92.30
3.36
0.47
0.28
0.34
0.29
0.04
0.01
Dec. 29, 2025
123.78
0.88
0.74
0.27
0.24
0.20
0.03
0.02
Dec. 18, 2025
105.51
2.10
0.91
0.43
0.41
0.26
0.10
0.05
Dec. 1, 2025
118.64
2.78
0.93
0.66
0.60
0.37
0.12
0.12
Nov. 24, 2025
50.57
1.58
0.63
0.45
0.38
0.20
0.08
0.10
Nov. 18, 2025
75.34
1.76
0.57
0.42
0.49
0.23
0.09
0.16
Nov. 3, 2025
50.67
0.57
0.28
0.44
0.38
0.09
0.07
0.21
Oct. 29, 2025
95.21
0.49
0.11
0.50
0.42
0.14
0.06
0.22
Oct. 22, 2025
72.68
0.24
0.06
0.54
0.44
0.15
0.07
0.22
Oct. 6, 2025
148.83
0.46
0.23
0.77
0.60
0.25
0.14
0.21
Sept. 29, 2025
105.31
2.05
0.20
1.24
1.01
0.48
0.09
0.44
Sept. 17, 2025
128.29
5.23
0.51
1.05
0.79
0.39
0.06
0.34
Sept. 8, 2025
39.15
2.66
0.45
0.72
0.42
0.17
0.08
0.17
Cumulative harvest poundage totals
Values are in pounds.
Brine shrimp cumulative harvest poundage totals for the 2025-26 harvest season
Date
Lake
Shore
Salt ponds
Total
Feb. 4, 2026
30,301,738
10,326,934
0
40,628,672
Jan. 27, 2026
29,116,983
10,326,934
0
39,443,917
Jan. 22, 2026
28,621,093
10,326,934
0
38,948,027
Jan. 14, 2026
26,287,143
10,115,146
0
36,402,289
Jan. 12, 2026
Jan. 7, 2026
23,883,871
9,894,841
0
33,778,712
Dec. 31, 2025
22,496,949
9,687,741
0
32,184,690
Dec. 22, 2025
20,993,040
9,487,365
0
30,480,405
Dec. 3, 2025
15,391,865
8,598,961
0
23,990,826
Nov. 30, 2025
Nov. 25, 2025
14,682,792
8,083,185
0
22,765,977
Nov. 20, 2025
13,422,360
7,085,671
0
20,508,031
Nov. 5, 2025
9,739,587
4,423,664
0
14,163,251
Nov. 3, 2025
9,374,481
3,928,334
0
13,302,815
Oct. 26, 2025
6,701,975
2,711,267
0
9,413,242
Oct. 7, 2025
2,161,769
1,466,614
0
3,628,383
Oct. 1, 2025
72,237
237,851
0
310,088
2024-25 harvest seasonExpand submenu
Sampling run data
Sorted by brine shrimp sex and life stage. Values are per liter of lake water.
Brine shrimp sampling run summary for the 2024-25 harvest season
Date
Cysts
Nauplii
Juveniles
Males
Total females
Females
Females with eggs/naups
Females with cysts
Jan. 29, 2025
19.06
0.00
0.00
0.00
0.00
0.00
0.00
0.00
Jan. 23, 2025
23.98
0.00
0.00
0.00
0.00
0.00
0.00
0.00
Jan. 14, 2025
27.10
0.00
0.00
0.00
0.00
0.00
0.00
0.00
Jan. 8, 2025
78.46
0.00
0.00
0.00
0.00
0.00
0.00
0.00
Jan. 2, 2025
37.50
0.00
0.00
0.00
0.00
0.00
0.00
0.00
Dec. 18, 2024
49.35
0.07
0.01
0.09
0.11
0.04
0.01
0.05
Dec. 10, 2024
114.80
0.14
0.01
0.09
0.11
0.03
0.01
0.06
Dec. 2, 2024
55.93
0.25
0.05
0.15
0.19
0.06
0.02
0.11
Nov. 21, 2024
110.28
0.45
0.09
0.25
0.23
0.06
0.04
0.13
Nov. 8, 2024
64.25
0.34
0.06
0.59
0.54
0.11
0.14
0.29
Oct. 21, 2024
65.50
0.14
0.01
0.79
0.62
0.23
0.08
0.31
Oct. 15, 2024
50.68
0.15
0.08
0.71
0.72
0.27
0.14
0.31
Oct. 7, 2024
64.43
0.80
0.12
0.69
0.74
0.30
0.07
0.37
Oct. 1, 2024
138.64
1.38
0.31
1.17
1.20
0.54
0.12
0.54
Sept. 23, 2024
108.32
6.91
0.80
1.70
1.80
0.98
0.18
0.64
Sept. 18, 2024
90.12
11.64
2.81
1.46
1.56
0.77
0.20
0.59
Cumulative harvest poundage totals
Values are in pounds.
Brine shrimp cumulative harvest poundage totals for the 2024-25 harvest season
Date
Lake
Shore
Salt ponds
Total
Jan. 29, 2025
15,778,718
13,973,254
268,772
30,020,744
Jan. 26, 2025
15,645,333
13,942,020
266,203
29,853,556
Jan. 15, 2025
15,168,136
13,788,198
243,950
29,200,284
Jan. 9, 2025
15,011,044
13,554,545
236,901
28,802,490
Jan. 6, 2025
15,010,250
13,521,624
225,246
28,757,120
Dec. 22, 2024
13,978,830
13,193,488
205,488
27,377,806
Dec. 11, 2024
11,910,535
12,436,310
205,488
24,552,333
Dec. 4, 2024
9,758,025
11,930,626
203,128
21,891,779
Nov. 28, 2024
Nov. 25, 2024
6,708,068
11,409,682
178,352
18,296,102
Nov. 12, 2024
3,716,348
10,485,242
105,392
14,306,982
Oct. 22, 2024
1,262,428
7,670,205
18,104
8,950,737
Oct. 16, 2024
806,847
6,410,500
0
7,217,347
Oct. 8, 2024
444,309
3,475,202
0
3,919,511
Oct. 3, 2024
190,580
1,358,560
0
1,549,140
2023-24 harvest seasonExpand submenu
Sampling run data
Sorted by brine shrimp sex and life stage. Values are per liter of lake water.
Brine shrimp sampling run summary for the 2023-24 harvest season
Date
Cysts
Nauplii
Juveniles
Males
Total females
Females
Females with eggs/naups
Females with cysts
Jan. 29, 2024
9.23
0.00
0.00
0.00
0.00
0.00
0.00
0.00
Jan. 25, 2024
Jan. 22, 2024
9.43
0.00
0.00
0.01
0.00
0.00
0.00
0.00
Jan. 16, 2024
78.26
0.00
0.00
0.04
0.04
0.03
0.01
0.00
Jan. 3, 2024
32.72
0.07
0.01
0.24
0.23
0.15
0.05
0.03
Dec. 21, 2023
27.56
0.07
0.02
0.33
0.29
0.17
0.06
0.06
Dec. 18, 2023
22.46
0.12
0.03
0.33
0.34
0.21
0.06
0.07
Dec. 11, 2023
38.24
0.19
0.04
0.31
0.35
0.21
0.06
0.08
Dec. 4, 2023
38.93
0.43
0.05
0.42
0.40
0.22
0.06
0.12
Nov. 27, 2023
41.03
0.71
0.07
0.47
0.42
0.27
0.04
0.12
Nov. 15, 2023
42.99
1.03
0.10
0.55
0.67
0.31
0.07
0.29
Nov. 9, 2023
69.97
1.31
0.18
0.53
0.66
0.33
0.10
0.23
Oct. 30, 2023
79.02
1.60
0.36
0.95
0.99
0.37
0.15
0.46
Oct. 24, 2023
52.20
1.13
0.79
0.87
0.83
0.33
0.13
0.37
Oct. 16, 2023
55.93
1.16
0.36
0.48
0.45
0.19
0.04
0.22
Oct. 10, 2023
51.34
1.88
0.78
0.34
0.35
0.10
0.03
0.22
Oct. 4, 2023
57.85
1.78
0.31
0.48
0.39
0.10
0.02
0.27
Sept. 25, 2023
39.94
0.77
0.08
0.44
0.41
0.12
0.05
0.23
Cumulative harvest poundage totals
Values are in pounds.
Brine shrimp cumulative harvest poundage totals for the 2023-24 harvest season
Date
Lake
Shore
Salt ponds
Total
Jan. 30, 2024
16,996,726
11,412,757
230,849
28,640,332
Jan. 25, 2024
Jan. 23, 2024
15,471,883
11,338,570
227,089
27,037,542
Jan. 17, 2024
14,318,070
11,249,623
223,017
25,790,710
Jan. 8, 2024
14,287,718
11,119,795
208,465
25,615,978
Jan. 3, 2024
14,287,718
11,046,325
206,729
25,540,772
Jan. 1, 2024
Dec. 19, 2023
11,776,905
10,424,216
203,289
22,404,410
Dec. 17, 2023
11,233,029
10,320,947
201,769
21,755,745
Dec. 11, 2023
10,255,292
10,009,706
180,454
20,445,452
Nov. 28, 2023
9,301,986
9,351,044
91,974
18,745,004
Nov. 28, 2023
Nov. 19, 2023
8,701,768
8,936,228
59,398
17,697,394
Nov. 14, 2023
8,211,175
8,553,070
50,998
16,815,243
Nov. 10, 2023
Nov. 1, 2023
5,831,315
6,852,109
35,038
12,718,462
Oct. 30, 2023
Oct. 26, 2023
4,887,732
5,951,029
11,640
10,850,401
Oct. 17, 2023
3,267,453
3,761,187
9,240
7,037,880
Oct. 10, 2023
1,914,455
2,171,918
1,096
4,087,469
Oct. 5, 2023
668,008
932,436
0
1,600,444
2022-23 harvest seasonExpand submenu
Sampling run data
Sorted by brine shrimp sex and life stage. Values are per liter of lake water.
Brine shrimp sampling run summary for the 2022-23 harvest season
Date
Cysts
Nauplii
Juveniles
Males
Total females
Females
Females with eggs/naups
Females with cysts
Jan. 12, 2023
21.47
0.00
0.00
0.00
0.00
0.00
0.00
0.00
Jan. 4, 2023
17.62
0.00
0.00
0.00
0.00
0.00
0.00
0.00
Dec. 19, 2022
20.48
0.00
0.00
0.00
0.00
0.00
0.00
0.00
Dec. 5, 2022
127.81
0.00
0.00
0.02
0.03
0.02
0.01
0.00
Nov. 17, 2022
98.76
0.41
0.37
0.46
0.46
0.16
0.09
0.20
Oct. 31, 2022
86.45
1.46
0.44
0.31
0.29
0.09
0.06
0.13
Oct. 12, 2022
149.74
0.09
0.06
0.25
0.20
0.11
0.02
0.06
Sept. 26, 2022
274.95
0.00
0.01
0.41
0.42
0.28
0.01
0.12
Cumulative harvest poundage totals
Values are in pounds.
Brine shrimp cumulative harvest poundage totals for the 2022-23 harvest season
Date
Lake
Shore
Salt ponds
Total
Jan. 13, 2023
6,057,713
13,364,487
81,640
19,503,840
Jan. 5, 2023
5,900,509
13,140,547
81,640
19,122,696
Dec. 21, 2022
Dec. 20, 2022
5,595,696
12,565,757
81,640
18,243,093
Dec. 6, 2022
4,913,777
11,913,727
44,296
16,871,800
Nov. 20, 2022
3,370,934
11,158,217
44,296
14,573,447
Nov. 1, 2022
2,328,847
8,331,595
0
10,660,442
Oct. 13, 2022
752,449
4,131,831
0
4,884,280
2021-22 harvest seasonExpand submenu
Sampling run data
Sorted by brine shrimp sex and life stage. Values are per liter of lake water.
Brine shrimp sampling run summary for the 2021-22 harvest season
Date
Cysts
Nauplii
Juveniles
Males
Total females
Females
Females with eggs/naups
Females with cysts
Jan. 24, 2022
19.95
0.00
0.00
0.00
0.00
0.00
0.00
0.00
Jan. 20, 2022
11.58
0.00
0.00
0.00
0.00
0.00
0.00
0.00
Jan. 10, 2022
64.71
0.00
0.00
0.00
0.00
0.00
0.00
0.00
Dec. 20, 2021
18.97
0.01
0.00
0.02
0.01
0.00
0.01
0.00
Dec. 7, 2021
38.60
0.05
0.01
0.06
0.04
0.02
0.01
0.01
Nov. 29, 2021
43.07
0.04
0.01
0.12
0.05
0.02
0.01
0.02
Nov. 22, 2021
63.03
0.04
0.00
0.14
0.10
0.03
0.04
0.03
Nov. 15, 2021
64.42
0.12
0.00
0.19
0.13
0.06
0.02
0.04
Nov. 3, 2021
76.50
0.07
0.00
0.24
0.26
0.14
0.02
0.10
Oct. 28, 2021
133.34
0.09
0.01
0.31
0.29
0.14
0.04
0.11
Oct. 21, 2021
147.93
0.03
0.01
0.39
0.39
0.19
0.04
0.16
Sept. 27, 2021
171.75
0.50
0.24
0.72
0.72
0.46
0.06
0.20
Cumulative harvest poundage totals
Values are in pounds.
Brine shrimp cumulative harvest poundage totals for the 2021-22 harvest season
Date
Lake
Shore
Salt ponds
Total
Jan. 25, 2022
10,667,586
17,774,779
342,350
28,784,715
Jan. 24, 2022
Jan. 20, 2022
10,647,863
17,466,079
342,350
28,456,292
Jan. 10, 2022
9,767,159
17,097,753
342,350
27,207,262
Dec. 21, 2021
9,181,534
16,455,093
228,080
25,864,707
Dec. 8, 2021
8,527,590
15,633,703
99,820
24,261,113
Dec. 1, 2021
7,927,234
14,519,475
96,260
22,542,969
Nov. 22, 2021
6,994,307
12,875,625
93,310
19,963,242
Nov. 16, 2021
6,643,934
11,591,625
87,310
18,322,869
Nov. 7, 2021
5,724,262
9,487,055
5,360
15,216,677
Nov. 2, 2021
4,915,363
8,413,985
0
13,329,348
Oct. 26, 2021
2,469,503
7,254,855
0
9,724,358
2020-21 harvest seasonExpand submenu
Sampling run data
Sorted by brine shrimp sex and life stage. Values are per liter of lake water.
Brine shrimp sampling run summary for the 2020-21 harvest season
Date
Cysts
Nauplii
Juveniles
Males
Total females
Females
Females with eggs/naups
Females with cysts
Feb. 22, 2021
47.51
0.00
0.00
0.00
0.00
0.00
0.00
0.00
Feb. 1, 2021
53.37
0.00
0.00
0.00
0.00
0.00
0.00
0.00
Jan. 20, 2021
58.59
0.00
0.00
0.00
0.00
0.00
0.00
0.00
Jan. 4, 2021
62.28
0.00
0.00
0.00
0.00
0.00
0.00
0.00
Dec. 21, 2020
58.25
0.00
0.00
0.01
0.01
0.01
0.00
0.00
Dec. 7, 2020
77.75
0.39
0.02
0.07
0.08
0.04
0.02
0.02
Nov. 25, 2020
109.65
0.01
0.00
0.11
0.09
0.03
0.02
0.04
Nov. 12, 2020
181.83
0.05
0.02
0.19
0.17
0.04
0.04
0.08
Oct. 28, 2020
158.84
0.56
0.04
0.42
0.35
0.13
0.06
0.16
Oct. 13, 2020
220.09
3.30
0.20
0.69
0.73
0.31
0.12
0.30
Oct. 1, 2020
103.85
2.22
0.39
0.85
0.90
0.62
0.10
0.18
Sept. 15, 2020
84.26
4.81
0.39
0.39
0.31
0.14
0.05
0.12
Cumulative harvest poundage totals
Values are in pounds.
Brine shrimp cumulative harvest poundage totals for the 2020-21 harvest season
Date
Lake
Shore
Salt ponds
Total
Feb. 23, 2021
324,260
71,400
395,660
Feb. 1, 2021
21,600
0
21,600
Jan. 31, 2021
9,803,812
17,931,079
56,919
27,791,810
Jan. 27, 2021
Jan. 21, 2021
9,651,071
17,741,969
34,673
27,427,713
Jan. 5, 2021
8,861,302
17,033,301
30,905
25,925,508
Dec. 22, 2020
8,337,614
16,757,079
21,887
25,116,580
Dec. 10, 2020
7,665,561
16,240,750
19,679
23,925,990
Nov. 29, 2020
6,092,580
15,216,828
5,669
21,315,077
Nov. 15, 2020
3,828,169
13,116,580
2,737
16,947,486
Nov. 1, 2020
2,850,794
10,537,212
0
13,388,006
Oct. 15, 2020
1,943,254
6,224,909
0
8,168,163
Oct. 12, 2020
1,763,898
5,236,693
0
7,000,591
2019-20 harvest seasonExpand submenu
Sampling run data
Sorted by brine shrimp sex and life stage. Values are per liter of lake water.
Brine shrimp sampling run summary for the 2019-20 harvest season
Date
Cysts
Nauplii
Juveniles
Males
Total females
Females
Females with eggs/naups
Females with cysts
Jan. 20, 2020
53.24
0.01
0.00
0.00
0.00
0.00
0.00
0.00
Jan. 16, 2020
Jan. 7, 2020
42.64
0.01
0.00
0.00
0.00
0.00
0.00
0.00
Dec. 31, 2019
47.00
0.03
0.00
0.00
0.00
0.00
0.00
0.00
Dec. 19, 2019
89.68
0.13
0.00
0.01
0.01
0.01
0.00
0.00
Dec. 9, 2019
104.74
0.36
0.02
0.02
0.03
0.02
0.00
0.01
Dec. 2, 2019
72.56
0.26
0.04
0.04
0.03
0.01
0.01
0.01
Nov. 18, 2019
61.26
1.14
0.32
0.19
0.22
0.06
0.05
0.11
Nov. 12, 2019
129.49
1.48
0.26
0.32
0.27
0.04
0.07
0.16
Nov. 6, 2019
99.55
1.20
0.35
0.37
0.37
0.07
0.10
0.20
Oct. 31, 2019
144.72
2.01
0.21
0.35
0.35
0.04
0.06
0.24
Oct. 16, 2019
118.19
2.88
0.45
0.47
0.37
0.06
0.05
0.26
Oct. 7, 2019
107.08
1.42
0.12
0.34
0.34
0.05
0.05
0.24
Sept. 23, 2019
153.11
1.70
0.19
0.32
0.27
0.08
0.03
0.16
Aug. 13, 2019
67.93
4.38
0.08
0.53
0.44
0.22
0.07
0.15
Cumulative harvest poundage totals
Values are in pounds.
Brine shrimp cumulative harvest poundage totals for the 2019-20 harvest season
Date
Lake
Shore
Salt ponds
Total
Jan. 22, 2020
31,480,386
12,309,364
354,636
44,144,386
Jan. 16, 2020
Jan. 7, 2020
31,245,610
12,291,612
345,764
43,882,986
Jan. 1, 2020
30,944,365
12,192,132
334,692
43,471,189
Dec. 22, 2019
30,575,258
11,736,844
271,980
42,584,082
Dec. 11, 2019
27,139,140
11,627,940
201,084
38,968,164
Dec. 4, 2019
23,124,911
11,627,940
115,524
34,868,375
Nov. 20, 2019
21,859,906
10,837,924
56,700
32,754,530
Nov. 14, 2019
19,599,304
9,764,020
56,700
29,420,024
Nov. 10, 2019
16,870,046
8,856,532
56,700
25,783,278
Nov. 3, 2019
11,785,830
7,253,060
56,700
19,095,590
Nov. 2, 2019
Oct. 20, 2019
7,701,985
5,204,036
17,832
12,923,853
Oct. 8, 2019
3,457,316
2,615,883
0
6,073,199
2018-19 harvest seasonExpand submenu
Sampling run data
Sorted by brine shrimp sex and life stage. Values are per liter of lake water.
Brine shrimp sampling run summary for the 2018-19 harvest season
Date
Cysts
Nauplii
Juveniles
Males
Total females
Females
Females with eggs/naups
Females with cysts
Feb. 25, 2019
Feb. 8, 2019
77.99
0.00
0.00
0.00
0.00
0.00
0.00
0.00
Jan. 29, 2019
50.85
0.00
0.00
0.00
0.00
0.00
0.00
0.00
Jan. 24, 2019
42.16
0.00
0.00
0.00
0.00
0.00
0.00
0.00
Jan. 14, 2019
41.32
0.00
0.00
0.00
0.00
0.00
0.00
0.00
Jan. 8, 2019
79.22
0.00
0.00
0.00
0.00
0.00
0.00
0.00
Jan. 2, 2019
79.82
0.00
0.00
0.00
0.00
0.00
0.00
0.00
Dec. 18, 2018
46.21
0.02
0.00
0.01
0.01
0.01
0.00
0.00
Dec. 10, 2018
64.19
0.23
0.01
0.04
0.05
0.03
0.01
0.01
Dec. 5, 2018
107.65
0.39
0.01
0.07
0.05
0.03
0.01
0.01
Nov. 19, 2018
87.33
1.31
0.14
0.23
0.25
0.10
0.06
0.09
Nov. 13, 2018
106.34
1.52
0.19
0.29
0.39
0.20
0.05
0.13
Nov. 7, 2018
66.46
1.38
0.28
0.18
0.20
0.08
0.05
0.06
Oct. 22, 2018
81.91
1.80
0.23
0.32
0.35
0.17
0.05
0.13
Oct. 15, 2018
153.43
2.12
0.24
0.29
0.32
0.17
0.05
0.11
Oct. 1, 2018
108.05
3.01
0.28
0.22
0.21
0.11
0.03
0.08
Sept. 26, 2018
108.39
2.71
0.22
0.34
0.25
0.08
0.05
0.12
Aug. 23, 2018
79.62
2.38
0.34
0.36
0.07
0.07
0.21
Cumulative harvest poundage totals
Values are in pounds.
Brine shrimp cumulative harvest poundage totals for the 2018-19 harvest season
Date
Lake
Shore
Salt ponds
Total
Feb. 25, 2019
Feb. 10, 2019
602,482
157,596
104,917
864,995
Feb. 2, 2019
Jan. 31, 2019
15,062,825
17,647,705
707,698
33,418,228
Jan. 30, 2019
14,887,024
17,562,589
702,424
33,152,037
Jan. 29, 2019
Jan. 24, 2019
14,170,337
17,266,575
623,650
32,060,562
Jan. 16, 2019
12,493,915
17,090,885
497,258
30,082,058
Jan. 9, 2019
12,148,331
16,771,643
453,427
29,373,401
Jan. 3, 2019
Jan. 2, 2019
11,220,491
16,521,263
349,972
28,091,726
Dec. 19, 2018
10,000,235
15,957,764
273,275
26,231,274
Dec. 12, 2018
8,825,561
15,442,652
172,408
24,440,621
Dec. 9, 2018
8,272,914
15,239,828
160,121
23,672,863
Nov. 28, 2018
Nov. 20, 2018
6,675,282
13,656,591
33,284
20,365,157
Nov. 14, 2018
5,328,528
12,739,416
33,284
18,101,228
Nov. 13, 2018
Nov. 7, 2018
4,230,914
11,534,869
20,784
15,786,567
Oct. 26, 2018
Oct. 24, 2018
3,550,718
8,245,814
16,530
11,813,062
Oct. 21, 2018
2,509,378
7,493,252
16,530
10,019,160
Oct. 13, 2018
Oct. 3, 2018
219,892
1,365,623
1,800
1,587,315
2017-18 harvest seasonExpand submenu
Sampling run data
Sorted by brine shrimp sex and life stage. Values are per liter of lake water.
Brine shrimp sampling run summary for the 2017-18 harvest season
Date
Cysts
Nauplii
Juveniles
Males
Total females
Females
Females with eggs/naups
Females with cysts
Jan. 16, 2018
8.13
0.02
0.00
0.00
0.00
0.00
0.00
0.00
Jan. 11, 2018
15.39
0.04
0.00
0.00
0.00
0.00
0.00
0.00
Jan. 8, 2018
9.07
0.02
0.00
0.00
0.00
0.00
0.00
0.00
Jan. 2, 2018
22.70
0.13
0.00
0.01
0.01
0.00
0.00
0.00
Dec. 27, 2017
11.23
0.16
0.00
0.02
0.01
0.00
0.00
0.00
Dec. 18, 2017
44.36
0.89
0.13
0.05
0.04
0.01
0.01
0.02
Dec. 11, 2017
23.91
1.03
0.30
0.08
0.09
0.02
0.03
0.03
Dec. 5, 2017
40.63
0.94
0.37
0.14
0.08
0.01
0.03
0.04
Nov. 28, 2017
50.91
0.96
0.29
0.19
0.14
0.03
0.02
0.09
Nov. 20, 2017
57.55
1.25
0.24
0.26
0.22
0.06
0.07
0.09
Nov. 13, 2017
68.65
1.24
0.20
0.51
0.36
0.05
0.10
0.21
Nov. 6, 2017
98.85
0.76
0.04
0.47
0.34
0.10
0.07
0.16
Oct. 31, 2017
92.57
0.62
0.01
0.44
0.38
0.09
0.08
0.21
Oct. 23, 2017
106.27
0.35
0.02
0.37
0.36
0.12
0.04
0.21
Oct. 16, 2017
59.93
0.20
0.02
0.35
0.29
0.06
0.09
0.14
Oct. 5, 2017
83.69
0.28
0.05
0.54
0.45
0.10
0.15
0.20
Sept. 25, 2017
61.53
1.22
0.10
0.55
0.49
0.11
0.12
0.26
Cumulative harvest poundage totals
Values are in pounds.
Brine shrimp cumulative harvest poundage totals for the 2017-18 harvest season
Date
Lake
Shore
Salt ponds
Total
Jan. 16, 2018
20,105,181
14,426,720
92,672
34,624,573
Jan. 11, 2018
19,976,638
14,408,520
57,488
34,442,646
Jan. 9, 2018
19,806,035
14,330,098
57,488
34,193,621
Jan. 3, 2018
19,138,108
14,164,454
57,488
33,360,050
Jan. 1, 2018
18,779,650
14,081,916
57,488
32,919,054
Dec. 19, 2017
17,694,721
13,590,122
51,134
31,335,977
Dec. 18, 2017
17,331,826
13,528,596
51,134
30,911,556
Dec. 12, 2017
16,642,799
13,121,231
54,134
29,818,164
Nov. 30, 2017
14,331,027
12,110,631
51,254
26,492,912
Nov. 21, 2017
11,988,628
11,156,275
25,190
23,170,093
Nov. 15, 2017
9,493,814
10,423,441
15,308
19,932,563
Nov. 14, 2017
Nov. 12, 2017
Nov. 8, 2017
7,060,881
9,149,974
14,200
16,225,055
Nov. 2, 2017
6,524,153
7,809,630
12,400
14,346,183
Oct. 25, 2017
4,703,589
5,771,241
12,400
10,487,230
Oct. 23, 2017
4,040,432
5,203,394
12,400
9,256,226
Oct. 11, 2017
1,075,139
2,281,599
12,400
3,369,138
Oct. 6, 2017
2016-17 harvest seasonExpand submenu
Sampling run data
Sorted by brine shrimp sex and life stage. Values are per liter of lake water.
Brine shrimp sampling run summary for the 2016-17 harvest season
Date
Cysts
Nauplii
Juveniles
Males
Total females
Females
Females with eggs/naups
Females with cysts
Jan. 26, 2017
10.71
0.00
0.00
0.00
0.00
0.00
0.00
0.00
Jan. 18, 2017
4.50
0.00
0.00
0.00
0.00
0.00
0.00
0.00
Jan. 12, 2017
35.48
0.00
0.00
0.00
0.00
0.00
0.00
0.00
Jan. 6, 2017
63.30
0.02
0.00
0.00
0.00
0.00
0.00
0.00
Jan. 5, 2017
Jan. 3, 2017
19.11
0.00
0.00
0.00
0.00
0.00
0.00
0.00
Dec. 27, 2016
12.99
0.00
0.00
0.00
0.00
0.00
0.00
0.00
Dec. 19, 2016
38.56
0.06
0.04
0.03
0.02
0.02
0.00
0.00
Dec. 6, 2016
67.86
1.23
1.26
0.15
0.13
0.09
0.00
0.04
Nov. 22, 2016
90.99
3.94
1.95
0.28
0.21
0.10
0.02
0.09
Nov. 14, 2016
37.34
4.19
2.70
0.34
0.22
0.10
0.03
0.10
Nov. 7, 2016
38.88
2.87
1.70
0.52
0.34
0.12
0.05
0.16
Nov. 2, 2016
124.29
2.86
0.94
0.34
0.25
0.06
0.03
0.16
Oct. 25, 2016
87.16
0.96
0.11
0.58
0.40
0.13
0.03
0.25
Oct. 19, 2016
116.17
0.75
0.14
0.52
0.34
0.18
0.02
0.14
Oct. 12, 2016
122.29
0.54
0.18
0.40
0.32
0.11
0.01
0.20
Oct. 6, 2016
73.97
0.72
0.14
0.54
0.52
0.25
0.02
0.25
Sept. 26, 2016
46.58
1.96
0.43
0.72
0.60
0.34
0.03
0.24
Cumulative harvest poundage totals
Values are in pounds.
Brine shrimp cumulative harvest poundage totals for the 2016-17 harvest season
Date
Lake
Shore
Salt ponds
Total
Jan. 29, 2017
12,624,111
19,071,491
371,186
32,066,788
Jan. 18, 2017
12,414,951
18,885,221
315,136
31,615,308
Jan. 16, 2017
12,359,824
18,785,602
308,096
31,453,522
Jan. 9, 2017
11,948,206
18,666,145
283,856
30,898,207
Jan. 5, 2017
Jan. 3, 2017
11,919,329
18,655,098
277,616
30,852,043
Dec. 28, 2016
11,669,998
18,582,300
251,946
30,504,244
Dec. 21, 2016
11,433,308
18,349,692
231,806
30,014,806
Dec. 11, 2016
10,968,035
17,658,746
197,822
28,824,603
Nov. 27, 2016
10,618,724
16,278,579
121,382
27,018,685
Nov. 16, 2016
9,793,243
14,513,384
70,690
24,377,317
Nov. 13, 2016
9,343,620
13,925,956
65,244
23,334,820
Nov. 8, 2016
7,445,557
12,815,908
56,441
20,317,906
Oct. 30, 2016
4,912,441
10,758,523
50,002
15,720,966
Oct. 25, 2016
3,707,993
9,645,101
27,825
13,380,919
Oct. 18, 2016
2,009,002
7,462,465
19,075
9,490,542
Oct. 11, 2016
1,558,342
4,730,269
4,375
6,292,986
2015-16 harvest seasonExpand submenu
Sampling run data
Sorted by brine shrimp sex and life stage. Values are per liter of lake water.
Brine shrimp sampling run summary for the 2015-16 harvest season
Date
Cysts
Nauplii
Juveniles
Males
Total females
Females
Females with eggs/naups
Females with cysts
Jan. 26, 2016
36.22
0.00
0.00
0.00
0.00
0.00
0.00
0.00
Jan. 21, 2016
33.25
0.00
0.00
0.00
0.00
0.00
0.00
0.00
Jan. 19, 2016
27.09
0.00
0.00
0.00
0.00
0.00
0.00
0.00
Jan. 11, 2016
23.34
0.00
0.00
0.00
0.00
0.00
0.00
0.00
Jan. 4, 2016
53.72
0.04
0.00
0.00
0.00
0.00
0.00
0.00
Dec. 17, 2015
157.28
0.10
0.00
0.01
0.01
0.01
0.00
0.00
Dec. 8, 2015
50.60
0.01
0.00
0.03
0.04
0.04
0.00
0.00
Dec. 1, 2015
88.82
0.07
0.01
0.15
0.13
0.11
0.00
0.02
Nov. 23, 2015
46.61
0.28
0.05
0.33
0.25
0.19
0.01
0.05
Nov. 17, 2015
178.17
0.96
0.08
0.57
0.49
0.36
0.02
0.11
Nov. 12, 2015
94.62
0.73
0.10
0.49
0.42
0.31
0.01
0.09
Oct. 26, 2015
89.89
1.91
0.44
0.69
0.56
0.45
0.01
0.10
Oct. 22, 2015
80.18
3.58
0.78
1.04
0.87
0.70
0.02
0.15
Oct. 13, 2015
48.47
5.71
2.14
0.77
0.69
0.47
0.02
0.19
Oct. 5, 2015
64.96
8.13
1.98
0.66
0.52
0.35
0.04
0.14
Sept. 29, 2015
54.48
4.99
2.59
0.34
0.26
0.15
0.02
0.08
Sept. 23, 2015
56.77
4.04
1.34
0.56
0.29
0.16
0.03
0.09
Sept. 17, 2015
143.75
2.90
1.08
0.72
0.43
0.20
0.07
0.16
Sept. 9, 2015
95.98
7.84
0.72
0.86
0.61
0.27
0.14
0.20
Cumulative harvest poundage totals
Values are in pounds.
Brine shrimp cumulative harvest poundage totals for the 2015-16 harvest season
Date
Lake
Shore
Salt ponds
Total
Jan. 27, 2016
6,880,304
18,211,794
1,213,745
26,305,843
Jan. 24, 2016
6,779,508
18,157,670
1,179,741
26,116,919
Jan. 19, 2016
6,726,358
18,083,731
1,100,440
25,910,529
Jan. 11, 2016
6,507,944
17,942,445
969,540
25,419,929
Jan. 4, 2016
6,250,086
17,709,989
957,686
24,917,761
Dec. 22, 2015
5,724,870
17,448,427
855,255
24,028,552
Dec. 10, 2015
5,542,565
16,999,147
747,631
23,289,343
Dec. 7, 2015
Dec. 3, 2015
4,776,951
16,515,474
738,946
22,031,371
Nov. 24, 2015
4,601,568
15,810,013
710,561
21,122,142
Nov. 22, 2015
4,002,674
15,554,453
702,949
20,260,076
Nov. 17, 2015
3,753,945
14,877,722
646,370
19,278,037
Nov. 1, 2015
2,387,997
11,649,041
351,439
14,388,477
Oct. 27, 2015
2,387,035
10,258,100
270,113
12,915,248
Oct. 14, 2015
1,565,304
6,233,735
34,945
7,833,984
Oct. 9, 2015
Oct. 7, 2015
821,715
3,122,466
0
3,944,181
2014-15 harvest seasonExpand submenu
Sampling run data
Sorted by brine shrimp sex and life stage. Values are per liter of lake water.
Brine shrimp sampling run summary for the 2014-15 harvest season
Date
Cysts
Nauplii
Juveniles
Males
Total females
Females
Females with eggs/naups
Females with cysts
Jan. 20, 2015
19.78
0.00
0.00
0.00
0.00
0.00
0.00
0.00
Jan. 15, 2015
21.87
0.00
0.00
0.00
0.00
0.00
0.00
0.00
Jan. 14, 2015
23.73
0.00
0.00
0.00
0.00
0.00
0.00
0.00
Jan. 5, 2015
27.75
0.00
0.00
0.00
0.00
0.00
0.00
0.00
Dec. 29, 2014
65.57
0.05
0.08
0.04
0.04
0.04
0.00
0.00
Dec. 23, 2014
137.70
0.20
0.50
0.08
0.06
0.06
0.00
0.00
Dec. 15, 2014
71.53
0.38
0.54
0.13
0.07
0.07
0.00
0.00
Dec. 8, 2014
10.30
0.84
1.30
0.15
0.16
0.16
0.00
0.00
Nov. 26, 2014
56.27
1.03
2.80
0.34
0.13
0.12
0.00
0.00
Nov. 18, 2014
49.17
2.25
3.78
0.34
0.23
0.19
0.02
0.02
Nov. 4, 2014
101.53
2.25
1.47
0.28
0.17
0.07
0.03
0.06
Oct. 28, 2014
75.96
1.68
0.99
0.26
0.09
0.03
0.02
0.05
Oct. 20, 2014
61.57
0.41
0.96
0.32
0.20
0.07
0.04
0.08
Oct. 14, 2014
117.62
0.73
0.39
0.42
0.21
0.07
0.03
0.11
Oct. 6, 2014
107.34
1.19
0.15
0.58
0.38
0.15
0.09
0.14
Oct. 2, 2014
132.32
1.88
0.09
0.57
0.33
0.16
0.05
0.13
Sept. 22, 2014
135.81
7.61
0.48
0.94
0.71
0.43
0.11
0.17
Cumulative harvest poundage totals
Values are in pounds.
Brine shrimp cumulative harvest poundage totals for the 2014-15 harvest season
Date
Lake
Shore
Salt ponds
Total
Jan. 22, 2015
12,424,399
11,832,862
5,069
24,262,330
Jan. 16, 2015
12,258,387
11,660,235
5,069
23,923,691
Jan. 14, 2015
12,162,247
11,607,153
5,069
23,774,469
Jan. 7, 2015
12,016,824
11,517,806
5,069
23,539,699
Dec. 30, 2014
11,666,023
11,351,465
5,069
23,022,557
Dec. 23, 2014
11,666,023
11,254,883
5,069
22,925,975
Dec. 15, 2014
11,127,545
10,968,868
5,069
22,101,482
Dec. 10, 2014
10,990,039
10,750,632
5,069
21,745,740
Dec. 3, 2014
9,854,720
10,155,005
5,069
20,014,794
Nov. 19, 2014
7,401,543
9,580,834
5,069
16,987,446
Nov. 5, 2014
6,219,560
8,009,792
5,069
14,234,421
Nov. 2, 2014
5,612,992
7,668,273
5,069
13,286,334
Oct. 22, 2014
4,851,363
5,784,369
5,069
10,640,801
Oct. 15, 2014
3,831,194
4,233,548
5,069
8,069,811
Oct. 8, 2014
2,754,569
2,327,084
5,069
5,086,722
Oct. 6, 2014
2,036,344
1,775,893
5,069
3,817,306
2013-14 harvest seasonExpand submenu
Sampling run data
Sorted by brine shrimp sex and life stage. Values are per liter of lake water.
Brine shrimp sampling run summary for the 2013-14 harvest season
Date
Cysts
Nauplii
Juveniles
Males
Total females
Females
Females with eggs/naups
Females with cysts
Jan. 28, 2014
38.33
0.00
0.00
0.00
0.00
0.00
0.00
0.00
Jan. 21, 2014
32.28
0.00
0.00
0.00
0.00
0.00
0.00
0.00
Jan. 14, 2014
34.50
0.00
0.00
0.00
0.00
0.00
0.00
0.00
Jan. 6, 2014
58.89
0.00
0.00
0.00
0.00
0.00
0.00
0.00
Dec. 30, 2013
34.02
0.00
0.00
0.00
0.00
0.00
0.00
0.00
Dec. 18, 2013
34.11
0.01
0.00
0.01
0.01
0.00
0.00
0.00
Dec. 10, 2013
108.51
0.50
0.04
0.12
0.09
0.04
0.03
0.02
Nov. 25, 2013
86.72
1.45
0.15
0.32
0.19
0.09
0.04
0.06
Nov. 18, 2013
98.27
1.93
0.18
0.39
0.29
0.12
0.06
0.11
Nov. 12, 2013
97.27
1.76
0.14
0.41
0.31
0.11
0.06
0.14
Nov. 4, 2013
176.16
1.68
0.12
0.35
0.35
0.14
0.04
0.17
Oct. 30, 2013
130.84
1.94
0.14
0.37
0.63
0.19
0.04
0.40
Oct. 21, 2013
197.59
1.77
0.26
0.47
0.37
0.17
0.02
0.18
Oct. 16, 2013
201.30
3.28
0.19
0.67
0.47
0.19
0.03
0.26
Oct. 7, 2013
94.82
4.38
0.36
0.53
0.55
0.22
0.06
0.27
Oct. 1, 2013
146.67
6.98
0.48
0.73
0.55
0.23
0.09
0.23
Sept. 16, 2013
89.31
5.86
0.71
0.34
0.21
0.08
0.05
0.08
Cumulative harvest poundage totals
Values are in pounds.
Brine shrimp cumulative harvest poundage totals for the 2013-14 harvest season
Date
Lake
Shore
Salt ponds
Total
Jan. 29, 2014
15,310,594
11,003,294
899,901
27,213,789
Jan. 22, 2014
14,601,879
10,977,278
871,287
26,450,444
Jan. 15, 2014
14,241,740
10,955,353
849,338
26,046,431
Jan. 7, 2014
14,142,644
10,950,503
765,769
25,858,916
Dec. 30, 2013
13,667,155
10,947,603
726,955
25,341,713
Dec. 22, 2013
12,474,694
10,947,203
708,854
24,130,751
Dec. 11, 2013
11,750,481
10,934,603
618,797
23,303,881
Nov. 26, 2013
10,162,449
10,148,661
438,972
20,750,082
Nov. 20, 2013
9,859,942
9,109,842
408,087
19,377,871
Nov. 13, 2013
9,201,113
8,184,385
222,435
17,607,933
Nov. 6, 2013
6,490,724
6,555,054
122,977
13,168,755
Oct. 30, 2013
5,804,877
5,713,680
60,263
11,578,820
Oct. 24, 2013
Oct. 23, 2013
4,280,001
4,252,643
44,992
8,577,636
Oct. 17, 2013
2,381,227
2,654,423
44,992
5,080,642
Oct. 9, 2013
1,149,019
1,777,716
34,724
2,961,459
Oct. 2, 2013
411,429
401,440
28,832
841,701
2012-13 harvest seasonExpand submenu
Sampling run data
Sorted by brine shrimp sex and life stage. Values are per liter of lake water.
Brine shrimp sampling run summary for the 2012-13 harvest season
Date
Cysts
Nauplii
Juveniles
Males
Total females
Females
Females with eggs/naups
Females with cysts
Feb. 25, 2013
113.36
0.01
0.00
0.00
0.00
0.00
0.00
0.00
Feb. 18, 2013
37.76
0.00
0.00
0.00
0.00
0.00
0.00
0.00
Feb. 12, 2013
80.78
0.00
0.00
0.00
0.00
0.00
0.00
0.00
Feb. 4, 2013
40.92
0.00
0.00
0.00
0.00
0.00
0.00
0.00
Jan. 31, 2013
52.36
0.03
0.00
0.00
0.00
0.00
0.00
0.00
Jan. 15, 2013
71.45
0.04
0.00
0.00
0.00
0.00
0.00
0.00
Jan. 7, 2013
40.19
0.10
0.00
0.00
0.00
0.00
0.00
0.00
Jan. 2, 2013
77.88
0.15
0.01
0.01
0.00
0.00
0.00
0.00
Dec. 20, 2012
145.32
0.72
0.06
0.02
0.01
0.01
0.00
0.00
Dec. 13, 2012
127.49
1.09
0.18
0.06
0.04
0.01
0.01
0.02
Dec. 3, 2012
145.05
1.79
0.27
0.12
0.13
0.06
0.02
0.05
Nov. 29, 2012
119.41
1.44
0.25
0.16
0.18
0.07
0.01
0.10
Nov. 19, 2012
86.11
2.98
0.29
0.26
0.29
0.09
0.04
0.17
Nov. 13, 2012
92.88
1.39
0.17
0.28
0.24
0.07
0.02
0.16
Nov. 5, 2012
64.81
1.51
0.12
0.20
0.16
0.05
0.01
0.09
Oct. 29, 2012
88.29
1.13
0.20
0.20
0.24
0.09
0.03
0.12
Oct. 15, 2012
84.95
1.18
0.18
0.35
0.29
0.13
0.02
0.14
Oct. 9, 2012
112.25
1.17
0.16
0.29
0.24
0.09
0.03
0.11
Oct. 2, 2012
84.29
2.20
0.47
0.29
0.27
0.07
0.01
0.18
Sept. 26, 2012
87.39
3.24
0.29
0.30
0.31
0.12
0.04
0.15
Sept. 19, 2012
55.64
1.61
0.21
0.17
0.14
0.04
0.01
0.09
Sept. 12, 2012
107.60
2.68
0.28
0.42
0.42
0.13
0.09
0.21
Sept. 4, 2012
75.33
3.95
0.10
0.36
0.33
0.13
0.05
0.15
Aug. 20, 2012
50.49
5.08
0.96
0.60
0.87
0.59
0.11
0.17
Cumulative harvest poundage totals
Values are in pounds.
Brine shrimp cumulative harvest poundage totals for the 2012-13 harvest season
Date
Lake
Shore
Salt ponds
Total
Feb. 25, 2013
2,541,196
91,588
388,688
3,021,472
Feb. 19, 2013
2,526,346
66,084
249,944
2,842,374
Feb. 13, 2013
1,851,496
45,633
201,318
2,098,447
Feb. 5, 2013
1,209,565
13,664
100,086
1,323,315
Jan. 31, 2013
18,460,592
9,527,112
80,415
28,068,119
Jan. 16, 2013
16,599,932
9,323,134
42,191
25,965,257
Jan. 8, 2013
15,855,264
9,271,640
20,075
25,146,979
Jan. 2, 2013
14,828,532
9,121,297
20,075
23,969,904
Dec. 27, 2012
14,194,264
9,112,247
20,075
23,326,586
Dec. 19, 2012
13,689,491
8,853,094
20,075
22,562,660
Dec. 6, 2012
13,481,029
8,166,729
20,075
21,667,833
Nov. 28, 2012
11,849,632
7,677,284
20,075
19,546,991
Nov. 20, 2012
9,851,551
6,779,362
20,075
16,650,988
Nov. 14, 2012
7,445,574
6,141,165
20,075
13,606,814
Nov. 7, 2012
6,012,192
5,777,080
20,075
11,809,347
Nov. 5, 2012
Oct. 31, 2012
3,982,150
4,724,592
20,075
8,726,817
Oct. 16, 2012
750,033
3,406,566
6,500
4,163,099
Oct. 10, 2012
531,830
2,528,454
0
3,060,284
Oct. 3, 2012
156,310
776,105
0
932,415
2011-12 harvest seasonExpand submenu
Sampling run data
Sorted by brine shrimp sex and life stage. Values are per liter of lake water.
Brine shrimp sampling run summary for the 2011-12 harvest season
Date
Cysts
Nauplii
Juveniles
Males
Total females
Females
Females with eggs/naups
Females with cysts
Jan. 23, 2012
33.77
0.00
0.00
0.00
0.00
0.00
0.00
0.00
Jan. 13, 2012
21.30
0.03
0.00
0.00
0.00
0.00
0.00
0.00
Jan. 12, 2012
21.30
0.03
0.00
0.00
0.00
0.00
0.00
0.00
Jan. 9, 2012
13.90
0.03
0.00
0.00
0.00
0.00
0.00
0.00
Jan. 4, 2012
20.30
0.07
0.00
0.00
0.00
0.00
0.00
0.00
Jan. 3, 2012
21.73
0.07
0.00
0.00
0.00
0.00
0.00
0.00
Dec. 29, 2011
14.73
0.07
0.00
0.00
0.00
0.00
0.00
0.00
Dec. 27, 2011
27.07
0.15
0.00
0.10
0.10
0.00
0.00
0.00
Dec. 19, 2011
19.37
0.57
0.00
0.02
0.02
0.01
0.01
0.00
Dec. 12, 2011
40.66
0.97
0.06
0.05
0.06
0.02
0.02
0.02
Dec. 6, 2011
69.13
1.76
0.20
0.08
0.08
0.03
0.01
0.04
Nov. 28, 2011
43.75
2.67
0.51
0.16
0.16
0.06
0.04
0.07
Nov. 21, 2011
78.60
3.10
0.62
0.29
0.24
0.07
0.05
0.12
Nov. 14, 2011
91.89
2.60
0.61
0.29
0.28
0.10
0.06
0.12
Nov. 8, 2011
99.97
2.06
0.49
0.30
0.31
0.10
0.06
0.15
Oct. 31, 2011
49.37
1.53
0.40
0.31
0.35
0.12
0.05
0.18
Oct. 27, 2011
96.65
1.13
0.37
0.35
0.35
0.14
0.04
0.17
Oct. 18, 2011
68.17
1.89
0.20
0.51
0.54
0.30
0.05
0.19
Oct. 10, 2011
65.47
2.24
0.22
0.55
0.58
0.36
0.03
0.19
Sept. 27, 2011
31.66
6.23
1.36
0.58
0.73
0.55
0.07
0.12
Sept. 19, 2011
28.64
6.32
0.74
0.37
0.36
0.15
0.07
0.14
Sept. 13, 2011
41.46
3.28
0.63
0.32
0.33
0.12
0.06
0.16
Sept. 8, 2011
41.69
2.43
0.40
0.34
0.35
0.16
0.05
0.14
Aug. 29, 2011
45.56
19.23
0.52
0.45
0.39
0.11
0.11
0.17
Cumulative harvest poundage totals
Values are in pounds.
Brine shrimp cumulative harvest poundage totals for the 2011-12 harvest season
Date
Lake
Shore
Salt ponds
Total
Jan. 24, 2012
11,826,039
6,173,240
260,080
18,259,359
Jan. 18, 2012
11,751,399
6,065,420
221,770
18,038,589
Jan. 12, 2012
11,512,971
5,868,620
173,650
17,555,241
Jan. 10, 2012
11,487,201
5,782,280
173,650
17,443,131
Jan. 4, 2012
11,019,055
5,488,880
166,360
16,674,295
Jan. 3, 2012
10,884,245
5,443,100
161,470
16,488,815
Jan. 2, 2012
10,749,047
5,381,600
155,080
16,285,727
Dec. 28, 2011
10,202,823
5,223,170
132,520
15,558,513
Dec. 20, 2011
9,870,560
5,108,120
125,230
15,103,910
Dec. 15, 2011
9,205,738
4,975,970
118,000
14,299,708
Dec. 12, 2011
Nov. 29, 2011
8,146,000
4,403,690
90,300
12,639,990
Nov. 23, 2011
Nov. 22, 2011
6,275,020
3,691,100
86,400
10,052,520
Nov. 21, 2011
Nov. 15, 2011
5,479,986
2,763,320
86,400
8,329,706
Nov. 9, 2011
4,732,131
2,645,240
41,700
7,419,071
Nov. 2, 2011
4,580,378
2,411,450
33,900
7,025,728
Oct. 31, 2011
4,577,678
2,394,260
25,800
6,997,738
Oct. 19, 2011
2,608,781
1,529,400
0
4,138,181
Oct. 11, 2011
619,671
920,880
0
1,540,551
2010-11 harvest seasonExpand submenu
Sampling run data
Sorted by brine shrimp sex and life stage. Values are per liter of lake water.
Brine shrimp sampling run summary for the 2010-11 harvest season
Date
Cysts
Nauplii
Juveniles
Males
Total females
Females
Females with eggs/naups
Females with cysts
Dec. 13, 2010
21.91
0.00
0.00
0.02
0.02
0.01
0.00
0.00
Dec. 7, 2010
27.39
0.00
0.00
0.02
0.02
0.01
0.00
0.00
Dec. 2, 2010
28.01
0.00
0.00
0.03
0.03
0.02
0.01
0.01
Nov. 17, 2010
128.17
0.00
0.00
0.20
0.19
0.10
0.01
0.07
Nov. 12, 2010
105.15
0.00
0.01
0.26
0.25
0.14
0.02
0.09
Nov. 2, 2010
55.15
0.00
0.03
0.26
0.31
0.21
0.01
0.09
Oct. 28, 2010
153.50
0.00
0.02
0.30
0.32
0.23
0.01
0.09
Oct. 19, 2010
176.10
0.01
0.17
0.62
0.63
0.48
0.02
0.13
Oct. 11, 2010
88.71
0.48
0.23
0.84
0.69
0.63
0.01
0.05
Sept. 27, 2010
106.03
11.10
1.84
1.62
1.25
0.79
0.14
0.32
Sept. 23, 2010
165.98
19.57
2.34
2.24
1.66
0.88
0.24
0.54
Sept. 13, 2010
42.67
12.42
1.63
0.68
0.62
0.32
0.11
0.19
Sept. 7, 2010
88.69
5.48
0.24
0.38
0.35
0.12
0.05
0.18
Aug. 31, 2010
50.12
1.30
0.16
0.38
0.32
0.09
0.07
0.16
Cumulative harvest poundage totals
Values are in pounds.
Brine shrimp cumulative harvest poundage totals for the 2010-11 harvest season
